
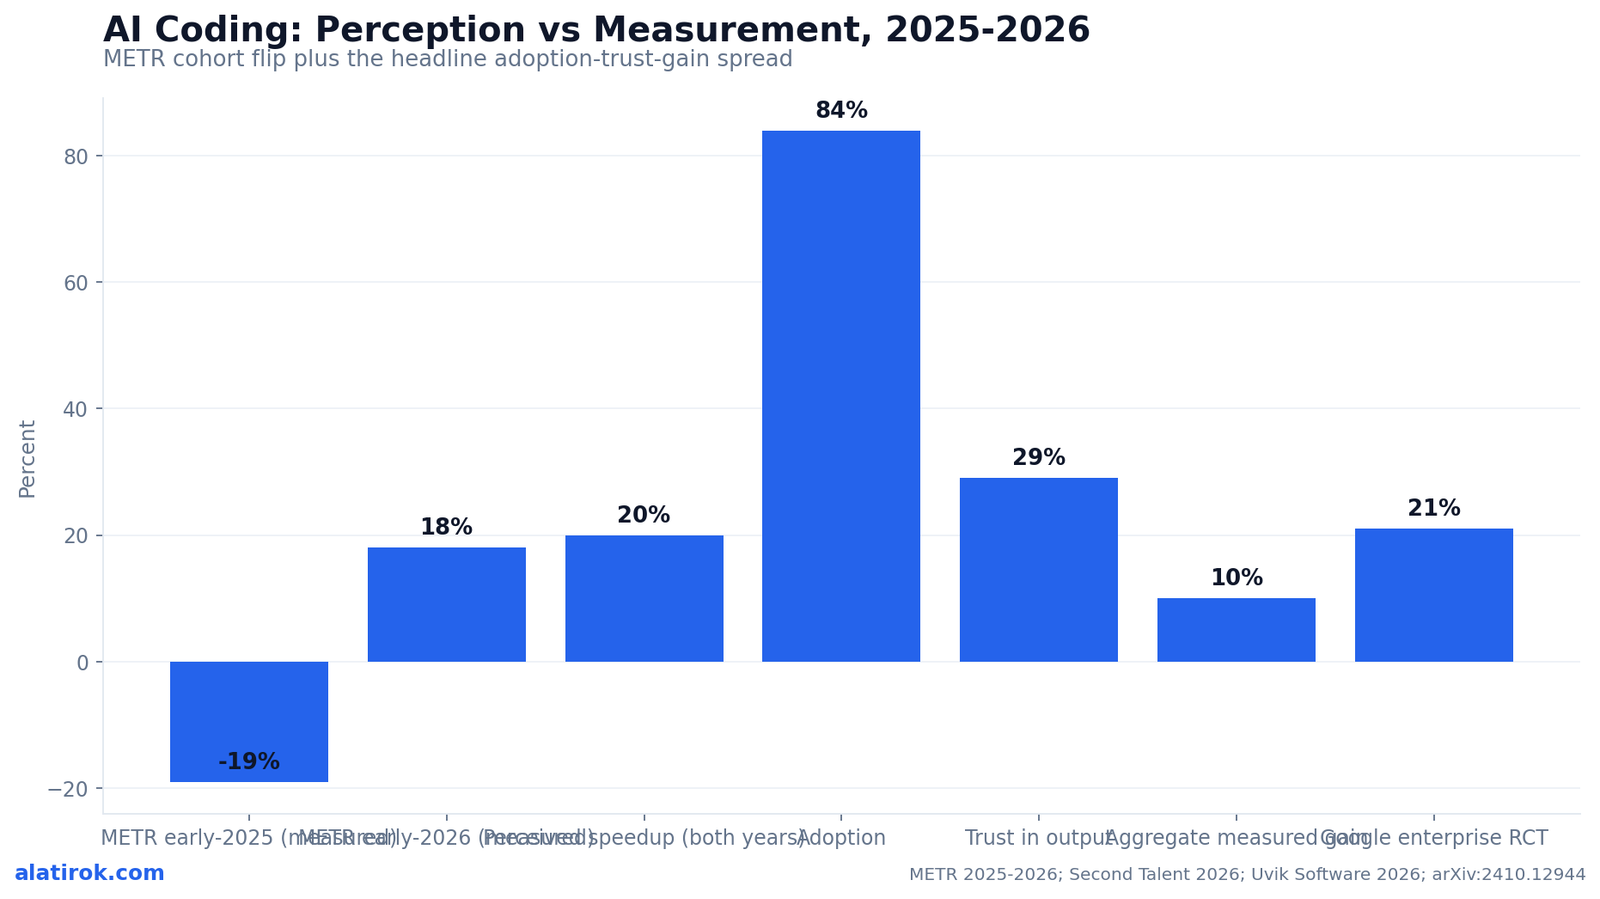
84% adoption, ~10% measured gains, and a famous RCT that flipped from a 19% slowdown to an 18% speedup in eleven months. What the data actually says.
What do the AI coding productivity statistics 2026 actually show?
84%
Developers using or planning to use AI tools
Stack Overflow 2025, n=49,000+
~10%
Aggregate measured productivity gain
Second Talent, 2026
29%
Developers who trust AI output as accurate
down from 40% in 2024
19%
Slowdown for experienced devs, early-2025 RCT
METR, 246 tasks
The AI coding productivity statistics 2026 reveal a near-universal tool with a modest, uneven payoff: roughly 84% of developers now use or plan to use AI coding assistants, yet measured aggregate productivity gains land around 10%, and trust in AI output sits at just 29%. Adoption is effectively settled; the return on that adoption is the open question.
Two facts make this hard to summarize in a single headline. First, the lift is wildly task-dependent: AI can make a developer 90% faster at boilerplate and 19% slower in a codebase they wrote themselves. Second, the most rigorous experiment on the subject, a randomized controlled trial by the research nonprofit METR, found that the same cohort of experienced developers went from measurably slower to measurably faster in under a year as the tools and their habits matured.
That combination, broad adoption plus thin and volatile measured gains, is the real story of 2026. The rest of this article unpacks the numbers behind it, with every figure traced to a primary source so you can see exactly where the headline ends and the asterisk begins.

The METR RCT: from a 19% slowdown to an 18% speedup
The most-cited single result, METR’s finding that AI made experienced developers 19% slower, came from a randomized controlled trial of 16 seasoned open-source contributors completing 246 real tasks on repositories averaging 22,000+ stars and 1M+ lines of code, and METR’s own February 2026 follow-up estimated those same developers had flipped to roughly an 18% speedup. The direction reversed; the certainty did not improve as much as the headlines imply.
In the early-2025 experiment, published July 2025, developers used the frontier tools of the day, primarily Cursor Pro with Claude 3.5/3.7 Sonnet. When AI was allowed, tasks took 19% longer, with a confidence interval running from +2% to +39%. The slowdown was driven by the overhead of prompting, waiting, and double-checking outputs that were ‘almost right, but not quite’ on code these developers knew intimately.
The February 2026 update told a different story. Re-running the design with late-2025 tools, METR estimated the original developers were now sped up by about 18% (confidence interval -38% to +9%), while a fresh group of new developers showed a smaller -4% effect (CI -15% to +9%). Read the signs carefully: METR writes speedup as a negative number, so -18% means tasks got 18% faster.
Crucially, METR cautioned that this newer data is weak evidence for the size of the improvement because of selection effects, not because the direction is in doubt. The point estimate moved 37 points in eleven months, but the error bars are wide enough that the honest takeaway is ‘probably positive now, magnitude uncertain.’
In METR’s 2026 paper, a -18% figure is an 18% SPEEDUP and +19% is a SLOWDOWN. The flip is from +19% (slower) to roughly -18% (faster) for the same developers using newer tools.
The perceived-versus-measured gap is the real headline
Even while measurably 19% slower, developers in the METR study believed AI had sped them up by about 20%, a roughly 40-point gap between what the stopwatch recorded and what practitioners felt. This is the most important and most under-reported finding in the entire AI coding productivity statistics 2026 conversation.
The numbers stack up cleanly. Before the trial, developers forecast a 24% speedup from being allowed to use AI. After completing the tasks, having lived through the actual slowdown, they still estimated AI had made them 20% faster. The lived experience of typing less and shipping a first draft fast feels like speed, even when total cycle time, including review and rework, gets longer.
This gap matters because most corporate AI-productivity claims rest on self-reported surveys, not instrumented measurement. A team that ‘feels 20% faster’ may be 19% slower, and you would never know without a controlled comparison. The DX dataset of 135,000+ developers reporting an average 3.6 hours saved per week is a self-report; it is useful, but it measures perception, which METR just demonstrated can be off by 40 points.
“Developers felt 20% faster while measuring 19% slower. The feeling and the stopwatch disagreed by nearly 40 points, and most productivity claims are built on the feeling.”
On the METR perception gap
Where AI actually helps: the task-type breakdown behind the 10%
The ~10% aggregate figure is a weighted average of dramatic wins on routine work and flat-to-negative results on novel work: AI delivers roughly +90% on boilerplate, +70% on tests, and +65% on documentation, but only +10% on system design and -19% in an unfamiliar codebase. The aggregate looks modest precisely because senior engineering time skews toward the low-lift categories.
Read the table below as a portfolio rather than a verdict. A junior developer writing CRUD endpoints and unit tests lives in the +70% to +90% zone, so their realized gains look enormous. A staff engineer untangling a concurrency bug in a service they architected lives in the -19% to +25% zone, so their gains are marginal and sometimes negative. Same tool, opposite outcomes, and the org-wide average lands near 10%.
This is also why benchmarks disagree so violently. Google’s enterprise RCT (arXiv:2410.12944), run with 96 full-time Google engineers on a complex enterprise-grade task, estimated roughly a 21% reduction in time on task, but with a wide confidence interval and a task chosen to suit AI assistance. METR’s open-source devs on their own mature repos saw the opposite early on. Neither is ‘wrong’; they measured different points on the same task-type curve.
| Task type | Productivity impact | Lift tier |
|---|---|---|
| Boilerplate code | +90% | High lift |
| Writing tests | +70% | High lift |
| Documentation | +65% | High lift |
| Refactoring | +50% | High lift |
| Debugging | +25% | Moderate |
| System design | +10% | Marginal |
| Unfamiliar / own codebase | -19% | Negative |
Adoption is near-universal but trust badly lags
The defining tension of 2026 is that 84% of developers use AI coding tools while only 29% trust the output as accurate, a trust figure that actually fell from 40% in 2024 even as adoption climbed. Developers are not adopting because they believe the code; they are adopting because the first draft is fast and the review is theirs to do anyway.
The supporting numbers reinforce the split. Per Stack Overflow’s 2025 data, 46% of developers actively distrust AI accuracy, and 66% cite frustration with output that is ‘almost right, but not quite’, the exact failure mode that turns a fast first draft into a slow debugging session. Meanwhile JetBrains found 85% regularly use AI for coding and Google’s DORA put daily team usage near 90%. Usage is saturated; confidence is not.
Quality data explains the caution. Independent analyses report a churn rate climbing toward 5.7% of lines (up from 3.1% in 2020 per GitClear’s 211M-line corpus), and a CodeRabbit review of 470 pull requests found AI-coauthored PRs carried 2.74x more security-relevant findings. Adoption without trust is a rational equilibrium when the tool is fast but the output needs guarding.
Pros
Cons
How to read these statistics without getting fooled
Treat any AI productivity number as conditional on three things: how it was measured (instrumented RCT versus self-report), which tasks it covers (routine versus novel), and which tool generation produced it, because the same cohort moved 37 points in eleven months. A figure without those three qualifiers is marketing, not measurement.
Start by discounting self-reports. METR’s 40-point perception gap is the cleanest evidence we have that ‘developers say’ figures, including the popular 3.6-hours-saved-per-week stat, capture feeling rather than realized cycle time. They are directionally interesting and should never be the sole basis for a tooling decision worth real money.
Then watch for selection effects, the exact trap that forced METR to redesign its experiment. By early 2026, 30% to 50% of developers told METR they declined to submit tasks they did not want to do without AI, and a growing share said they would not do half their work without it. That systematically removes the heaviest, most-helped users from the sample, biasing task-level results downward and making clean measurement genuinely hard. The honest 2026 position is: adoption is settled, direction is probably positive, and precise magnitude is still contested.
Why is the Google enterprise RCT higher (~21%) than METR (~10% aggregate)?
Google’s arXiv:2410.12944 trial used 96 engineers on a single complex enterprise-grade task chosen for the study, with a wide confidence interval. METR used experienced contributors on their own mature open-source repos across 246 varied real tasks. Different task mix, different familiarity, different point on the lift curve. Both can be correct simultaneously.Does a wide confidence interval mean the result is useless?
No. METR’s early-2025 interval of +2% to +39% still excludes zero, so the slowdown was real even if its exact size was uncertain. The 2026 follow-up interval (-38% to +9% for original devs) does cross zero, which is why METR calls the speedup likely but not firmly sized. Direction and magnitude are separate claims with separate confidence.What’s the single most reliable takeaway?
That measured gains are smaller and far more task-dependent than perceived gains, and that they move with tool generation. If you instrument your own cycle time by task class and re-measure quarterly, you will beat any blog stat, including this one.The verdict on AI coding productivity in 2026
Settled adoption, contested gains, rising ceiling
AI coding tools in 2026 are a high-variance multiplier, not a flat productivity dividend: adoption is at 84%, measured aggregate gains hover near 10%, and the value you realize depends almost entirely on task mix, measurement discipline, and tool generation. The METR flip from a 19% slowdown to an 18% speedup proves the ceiling is rising, but the wide error bars and selection effects prove the hype outruns the evidence.
If you take one number from this piece, make it the 40-point gap between perceived and measured productivity. It is the reason so many teams ‘know’ AI works while their delivery metrics stay flat. Close that gap with instrumentation, route high-lift work to the tools and verify everything, and you will land well above the 10% average. Trust the direction of the 2026 data; verify the magnitude yourself.
Builder’s take
I run two products where AI writes a real share of the code, so I read the METR papers the way an operator reads a P&L, not a press release. Here is what the 2026 numbers changed about how I deploy these tools.
- The 84%-vs-10% gap is not a contradiction, it is a portfolio. Boilerplate, tests, and docs get the +50% to +90% lift; novel work in code you wrote yourself gets little or negative lift. Aggregate gains stay near 10% because most senior time is the second kind. I route tasks accordingly instead of buying one number.
- The perceived-vs-measured gap is the most expensive line item. Developers in the METR cohort felt ~20% faster while measuring 19% slower. On Cyntr I stopped trusting vibes and instrument cycle time per task class, because the feeling and the stopwatch disagreed by ~40 points.
- The METR flip to an 18% speedup is real signal but carries a wide confidence interval and brutal selection effects. METR itself says 30 to 50 percent of developers declined to submit tasks they did not want to do without AI. I treat the direction as trustworthy and the magnitude as soft.
- Trust at 29% against 84% adoption is the actual operating constraint. The bottleneck in 2026 is not generation, it is verification. I budget review time as a first-class cost and gate AI output behind tests and policy on every path, not optional spot-checks.
- Tool generation matters more than tool brand. The same developers got faster as Cursor, Claude, and agentic harnesses improved across 2025. The lesson is to re-measure every quarter, because last quarter’s slowdown can be this quarter’s speedup.
Frequently asked questions
About 84% of developers use or plan to use AI coding tools, per Stack Overflow’s 2025 survey of more than 49,000 developers. JetBrains found 85% regularly use AI for coding, and Google’s DORA put daily team usage near 90%. Adoption is effectively near-universal across the profession.
Yes. METR’s early-2025 randomized controlled trial of 16 experienced open-source developers across 246 tasks found that allowing AI tools made them 19% slower (confidence interval +2% to +39%). The developers used frontier tools of the time, primarily Cursor Pro with Claude 3.5/3.7 Sonnet on repositories they knew well.
Yes. METR’s February 2026 follow-up with late-2025 tools estimated the same original developers had flipped to roughly an 18% speedup (METR writes this as -18%), though with a wide confidence interval of -38% to +9% and significant selection effects. The direction reversed; the precise magnitude remains uncertain.
Because the ~10% aggregate is a weighted average. AI delivers +50% to +90% on routine work like boilerplate, tests, and documentation, but only ~10% on system design and -19% in code developers wrote themselves. Senior time skews toward low-lift tasks, pulling the org-wide average down near 10%.
In the METR RCT, developers believed AI sped them up by about 20% while it actually slowed them by 19%, a roughly 40-point gap. Typing less and producing a fast first draft feels like speed even when total cycle time, including review and rework, increases. It means self-reported productivity stats are unreliable on their own.
Only about 29% of developers trust AI output as accurate, down from 40% in 2024, even as adoption rose to 84%. Stack Overflow’s 2025 data shows 46% actively distrust accuracy and 66% are frustrated by output that is ‘almost right, but not quite.’ Adoption is high, but confidence in the output is not.
Primary sources
- Measuring the Impact of Early-2025 AI on Experienced Open-Source Developer Productivity — METR
- We Are Changing Our Developer Productivity Experiment Design (Feb 2026 update) — METR
- 84% of Developers Use AI Tools. Productivity Gains Are Only 10%. — Second Talent
- AI Coding Assistant Statistics 2026 — Uvik Software
- How much does AI impact development speed? An enterprise-based randomized controlled trial (arXiv:2410.12944) — Google / arXiv
- Measuring the Impact of Early-2025 AI on Experienced Open-Source Developer Productivity (arXiv:2507.09089) — METR / arXiv
Last updated: June 1, 2026. Related: Products.