
Anthropic’s observed-exposure ranking shows where AI is actually doing the work. Challenger’s monthly cut data shows where that work is turning into layoffs.
Which occupations is AI actually doing the work in?
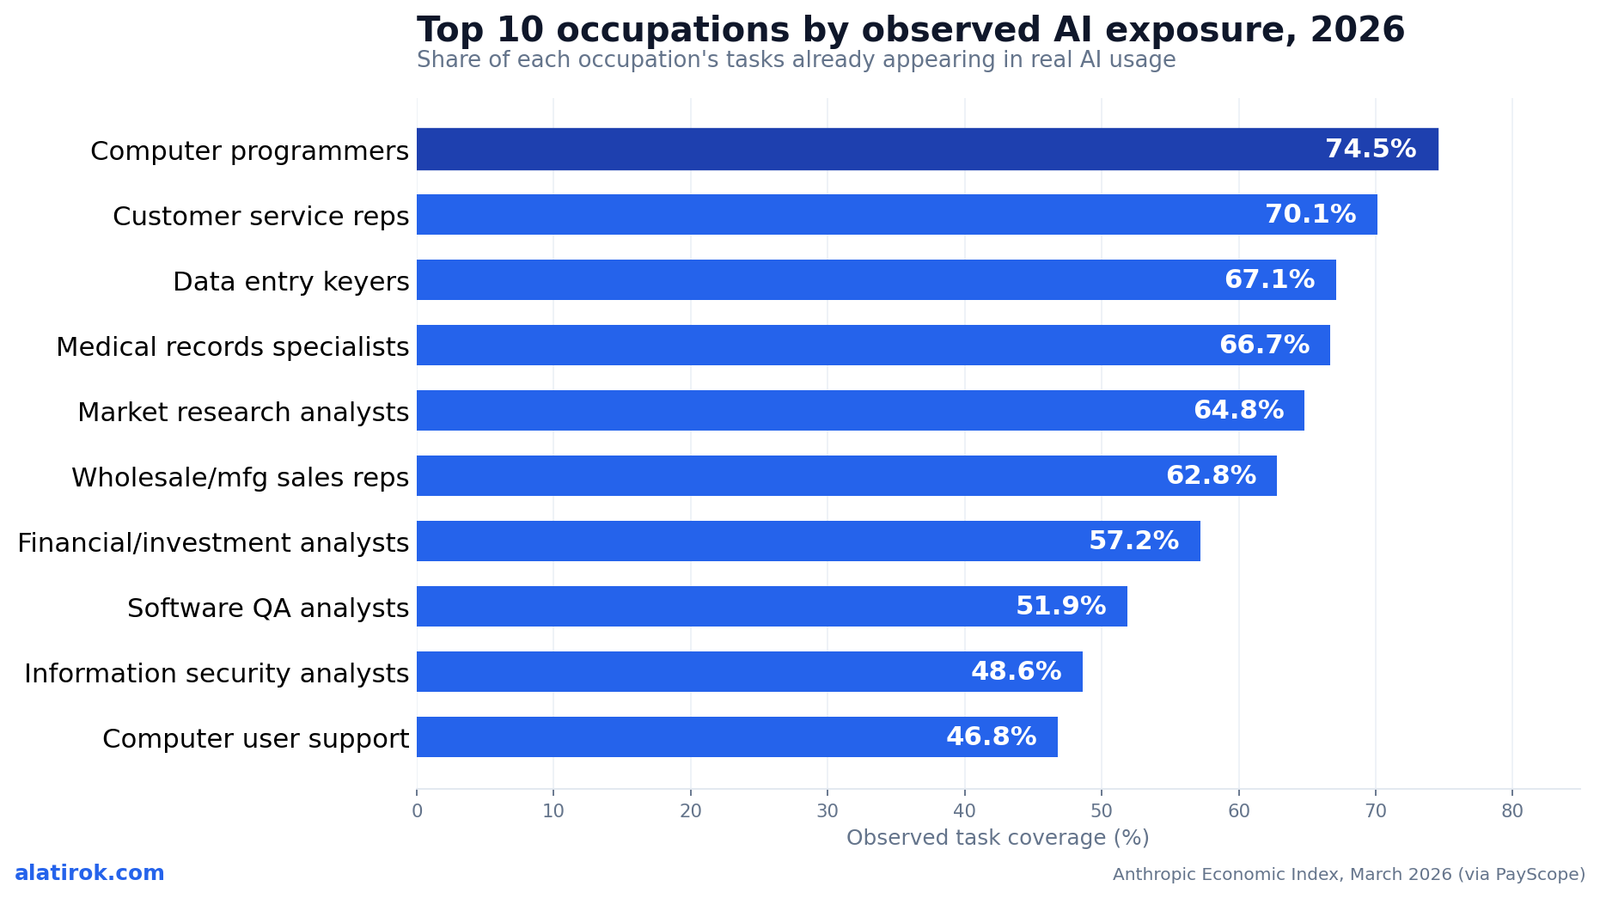
As of the March 2026 Anthropic Economic Index, AI does the largest measured share of the work in computer programming (74.5% observed task coverage), followed by customer service representatives (70.1%), data entry keyers (67.1%), and medical records specialists (66.7%). These are not predictions about who gets replaced. They are measurements of which job tasks already appear, at meaningful volume, inside real AI usage logs. That index reframes the AI job exposure by occupation 2026 debate around tasks, not job titles.
That distinction is the entire reason this dataset matters. For three years, the AI-and-jobs conversation ran on theoretical exposure scores — academic estimates of what a model could do if deployed. Anthropic’s “observed exposure” metric throws that out and asks a narrower, harder question: of the tasks that make up an occupation, which ones are people actually handing to Claude right now? A task counts as covered only if it is both technically feasible and shows sufficient real work-related usage in traffic, with fully automated uses weighted at full value and assistive uses at half.
Run that filter and the picture sharpens. Computer and mathematical occupations have a theoretical ceiling near 94%, but observed deployment sits around 35% for the category as a whole — even as individual roles like programmer hit 74.5%. The headline isn’t that AI can do everything. It’s that for a specific cluster of desk jobs built out of language, code, and structured data, the gap between ‘could’ and ‘is doing’ has nearly closed.

AI job exposure by occupation 2026: the top 10 ranked
The 10 most AI-exposed US occupations in 2026, by observed task coverage, run from computer programmers at 74.5% down to computer user support specialists at 46.8% — a tight band of language-, code-, and data-heavy desk roles. Every occupation on this list shares one trait: its core output is information that can be produced, transformed, or checked without anyone being physically present.
Read the ranking carefully and a sorting logic appears. Roles where the task is the job — data entry, customer service scripts, record coding — cluster near the top because there is little judgment wrapped around the keystrokes. Roles lower on the list, like information security analysts (48.6%) and user support (46.8%), still involve heavy AI use but carry more context, escalation, and accountability that a model can assist but not yet own. That structural difference is why AI job exposure by occupation 2026 should be read as a map of task reachability, not a layoff schedule.
The chart below is the canonical version of this ranking. Treat the percentages as a ceiling on how much of each role an agent can currently touch — not a count of jobs eliminated.
About 30% of US workers show zero observed AI exposure: cooks, motorcycle mechanics, lifeguards, bartenders, dishwashers. The common thread is physical presence, manual dexterity, and real-time human interaction in unpredictable environments — the tasks language models still cannot reach at all.
Observed exposure versus theoretical capability: why the gap matters
Theoretical capability asks what a model could do; observed exposure measures what people are actually doing with it — and for most occupations the second number is far lower than the first. Anthropic’s own data makes the gap concrete: computer and math work is theoretically ~94% AI-feasible, yet observed category deployment sits near 35%. The capability is sitting on the shelf faster than organizations are picking it up.
Two forces keep observed exposure below the theoretical ceiling. The first is workflow inertia — feasible tasks that nobody has rewired their process to delegate yet. The second is the augmentation-versus-automation split. On Claude.ai, roughly 52% of conversations are augmentation (the AI complements a human) versus about 45% automation (the AI does the task with minimal interaction). Enterprise API traffic skews far more automated, around 75%. Where work runs through an API pipeline, observed exposure converts to actual displacement much faster than where a human sits in the loop.
Anthropic’s March 2026 report adds a third wrinkle that reframes the whole exposure debate: a learning curve. Users on the platform for six months or more are 3 to 4 percentage points more likely to have a successful conversation, even after controlling for task, model, and country. Exposure isn’t static. The same task gets more reachable as the workforce around it gets more fluent — which means today’s 74.5% is a floor for tomorrow, not a ceiling.
“Your exposure number is the share of your job an agent can touch. Your job security is one minus the share your employer thinks an agent can own unsupervised.”
The two fractions that define AI labor risk in 2026
Where exposure becomes layoffs: the Challenger time series
49,135
AI-attributed US cuts (YTD Apr 2026)
~16% of all 2026 cut plans
26%
Share of April cuts citing AI
2nd straight month AI led all reasons
4.6x
Growth in monthly AI cuts
4,680 (Feb) to 21,490 (Apr)
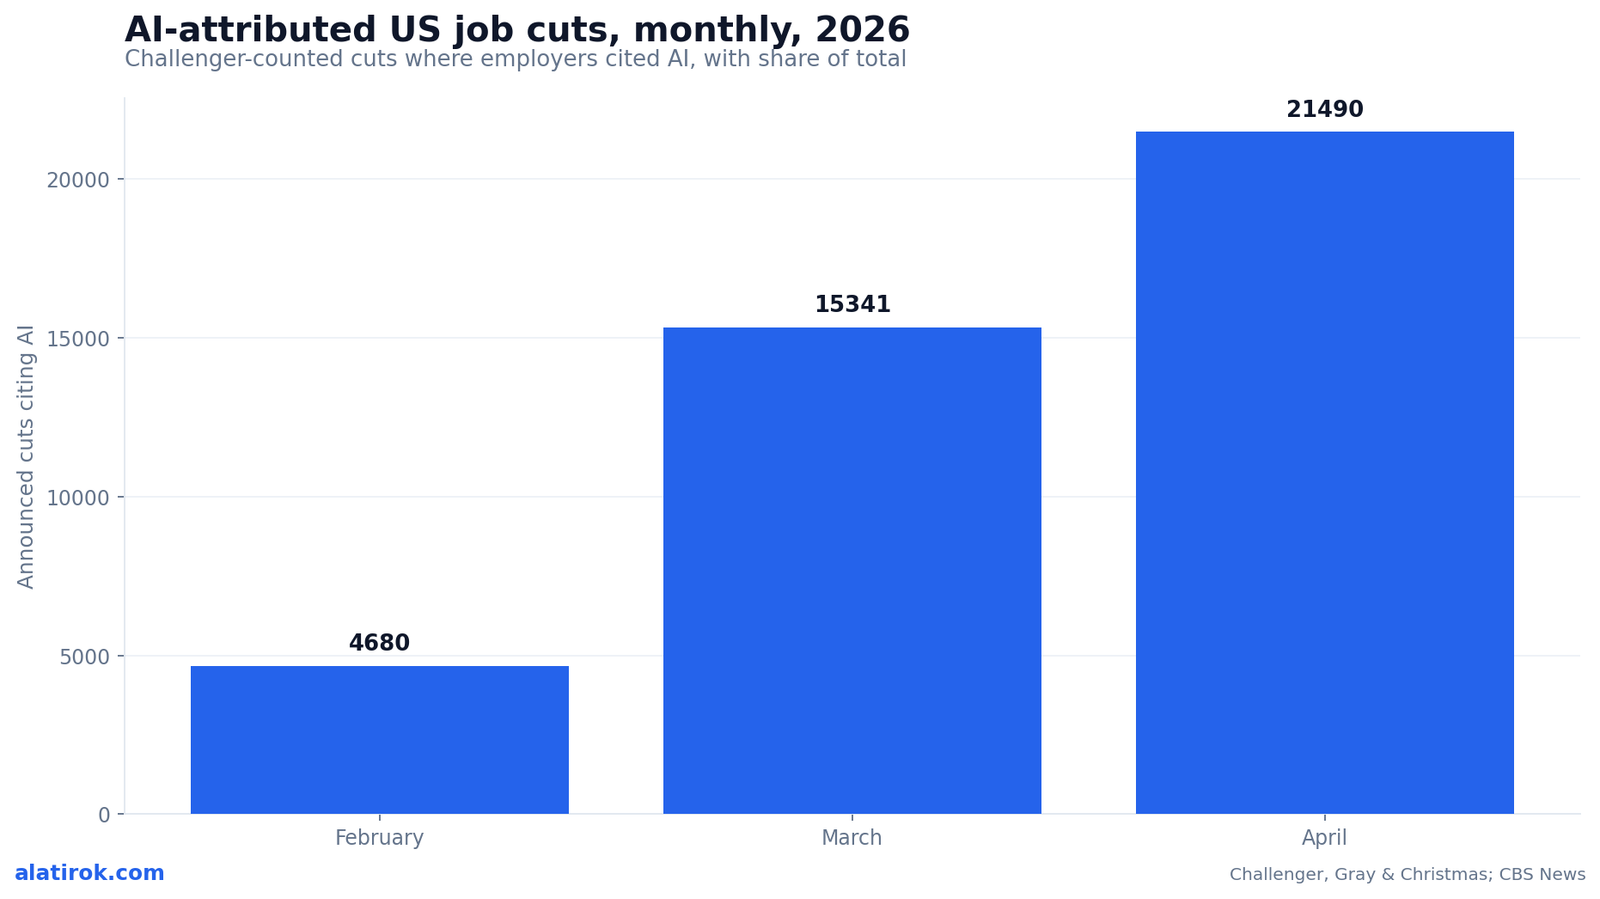
AI was cited as the reason for 49,135 announced US job cuts through April 2026 — roughly 16% of all 2026 cut plans — and the monthly trend is accelerating sharply, from 4,680 cuts in February to 15,341 in March to 21,490 in April. That is the Challenger, Gray & Christmas series, and it is the closest thing the market has to a real-time meter on AI turning from capability into headcount decisions.
The acceleration is the part that should hold your attention. In February, AI accounted for about 10% of that month’s cuts. By March it was 25%, and in April it hit 26% of all announced cuts — the second straight month AI led every other stated reason for layoffs, ahead of cost-cutting and restructuring. The technology sector alone announced 33,361 cuts in April, the single largest slice. Through March, AI was 13% of cumulative 2026 plans; one month later it was 16%. The line is bending up, not flattening.
Two cautions keep this honest. First, these are announced cuts with a stated reason — “AI” is increasingly a convenient label that can mask ordinary cost-cutting, so read the trend more confidently than any single figure. Second, Challenger counts plans, not completed separations. But even discounted, a series that more than quadrupled in three months is signal, not noise.
Reading the two datasets together
Exposure and cuts tell different halves of the story: Anthropic shows which tasks AI can reach, Challenger shows which of those reaches a company is willing to convert into a layoff — and the conversion rate is highest where the task is the entire job. Overlay the two and the most dangerous quadrant is obvious. It’s the roles that are both high-exposure and low-judgment: customer service, data entry, basic record processing.
Compare two roles at similar exposure. A computer programmer sits at 74.5% observed exposure but rarely shows up at the top of layoff lists, because the exposed tasks sit beneath architecture, review, and ownership that a model can accelerate but not be accountable for. A customer service rep sits at 70.1% — but the exposed tasks are the deliverable, so the same exposure number maps to far higher displacement risk. Exposure tells you the size of the target; job structure tells you how exposed the bullseye is.
Goldman Sachs supplies the long-run frame. The bank raised its estimate of US work tasks automatable by generative AI from 25% in 2023 to 34% in 2026, implying eventual displacement of roughly 6–7% of the workforce — about 11 million workers — with current AI-driven net displacement running near 16,000 jobs a month. Challenger’s 2026 monthly figures are now in the same order of magnitude as that long-run pace, which suggests the slow-burn forecast has started arriving on schedule.
| Source | What it measures | Headline 2026 figure | Key limitation |
|---|---|---|---|
| Anthropic Economic Index | Observed task coverage in real AI usage | Programmers 74.5%; ~30% of workers at zero | Reachability, not jobs lost |
| Challenger, Gray & Christmas | Announced cuts citing AI as the reason | 49,135 YTD; 21,490 in April (26%) | Stated reason; plans, not separations |
| Goldman Sachs | Tasks automatable + long-run displacement | 34% automatable; ~11M workers long term | Forecast, wide confidence band |
What this means for workers, employers, and policymakers
For individuals, the durable strategy is to move toward tasks that require judgment, accountability, or physical presence; for employers, the play is to re-architect high-exposure, high-automation functions before competitors force the timing; for policymakers, the signal is that displacement is now measurable monthly and warrants real-time tracking rather than annual studies.
Workers in the top-10 exposed roles shouldn’t read the numbers as a countdown — they should read them as a map of which parts of their day to stop competing on. The learning-curve finding cuts both ways: fluency compounds, so the people who pair with AI early widen a 3–4 point advantage that becomes a moat. The 30% zero-exposure floor is a reminder that physical-presence work is, for now, the most AI-proof category in the economy.
Employers get the cleanest signal. The augmentation-to-automation gap is the lever: a function running 75% automated through an API converts exposure to savings far faster than one stuck at 52% augmentation. Policymakers, meanwhile, now have something they lacked in prior automation waves — a monthly time series. When AI-attributed cuts more than quadruple in three months, the case for measuring displacement in real time, not in retrospective five-year studies, makes itself.
Pros
Cons
A 74.5% exposure score does not mean 74.5% of programmers lose their jobs. It means three-quarters of programming tasks appear in real AI usage. The job-loss signal lives in the Challenger series, not the exposure ranking — and even there, it’s announced plans, not confirmed separations.
The bottom line on AI job exposure by occupation 2026
Exposure is the ceiling; cuts are the speedometer; structure decides the gap.
AI is doing the most work in code, customer service, data entry, and records — but it is doing it as a tool inside jobs, and only a fraction of that exposure has converted to layoffs so far. The exposure ranking is the warning light; the Challenger series is the speedometer; Goldman’s 34% is the destination.
The most useful mental model from all three datasets: exposure is a stock, cuts are a flow, and the conversion rate between them depends almost entirely on how much judgment and accountability wraps the exposed tasks. That is why a 70.1%-exposed support rep can be more vulnerable than a 74.5%-exposed programmer. Watch the flow, but understand the structure.
Builder’s take
I run two AI products, so I read these two datasets the way a founder reads a burn-rate chart and a churn report side by side. One tells you what the model can carry; the other tells you what a CFO is willing to bet on it. They disagree, and the gap is the whole story.
- Observed exposure is a ceiling, not a forecast. When Anthropic says 74.5% of programmer tasks show up in Claude traffic, that means the tasks are reachable, not that 74.5% of programmers are gone. On my own teams, a coding agent doing three-quarters of the keystrokes still needs a human to own the architecture, the review, and the blame.
- The roles climbing Challenger’s list fastest are the ones where the task is also the whole job. A customer-service rep whose job is 70% answerable tasks is structurally more exposed than a programmer whose 74.5% sits under a layer of judgment the model cannot own.
- I would not staff a 2026 plan off either number alone. I pair them: exposure tells me which functions to re-architect around agents now, and the cut data tells me how fast competitors are forcing the issue. Treat the 30% zero-exposure floor as a feature — physical presence is the most durable moat a worker has this decade.
- The honest read for any individual: your exposure number is the share of your job an agent can touch, and your job security is one minus the share your employer thinks an agent can own unsupervised. Those are very different fractions, and 2026 is the year the second one starts catching up.
Frequently asked questions
Observed exposure is the share of an occupation’s tasks that actually appear in real AI usage at meaningful volume — not what a model could theoretically do. A task counts only if it is both feasible and shows sufficient work-related usage, with fully automated uses weighted at full value and assistive uses at half. It measures task reachability, not jobs eliminated.
Computer programmers, at 74.5% observed task coverage in the March 2026 Anthropic Economic Index. They are followed by customer service representatives (70.1%), data entry keyers (67.1%), medical records specialists (66.7%), and market research analysts (64.8%).
Roughly 30% of US workers show zero observed AI exposure, almost all in physical-presence roles: cooks, motorcycle mechanics, lifeguards, bartenders, and dishwashers. The common thread is manual dexterity and real-time human interaction in unpredictable environments — tasks language models cannot reach.
Through April 2026, Challenger, Gray & Christmas attributed 49,135 announced US job cuts to AI — about 16% of all 2026 cut plans. Monthly AI-attributed cuts rose from 4,680 in February (10% of cuts) to 15,341 in March (25%) to 21,490 in April (26%), making AI the leading stated reason for layoffs two months running.
No. Exposure measures how many of a job’s tasks AI can reach, not how many workers lose their jobs. A programmer at 74.5% exposure rarely tops layoff lists because the exposed tasks sit under architecture and accountability a model cannot own. Job loss tracks job structure — how much judgment surrounds the task — more than the raw exposure number.
Goldman Sachs raised its estimate of US work tasks automatable by generative AI from 25% in 2023 to 34% in 2026, implying long-term displacement of roughly 6–7% of the workforce, or about 11 million workers. It currently estimates AI-driven net displacement of around 16,000 US jobs per month.
Primary sources
- Anthropic Economic Index report: Learning curves (March 2026) — Anthropic
- AI job exposure by occupation: 800 roles ranked for 2026 — PayScope
- Challenger Report: April Job Cuts Rise 38% from March — Challenger, Gray & Christmas
- AI emerges as a top cause of layoffs, accounting for 26% of April’s job cuts — CBS News
- How Will AI Affect the US Labor Market? — Goldman Sachs
- Anthropic Finds Customer Service Reps Among Jobs Most Vulnerable to AI — CMSWire
Last updated: June 1, 2026. Related: Governance.