Your agent isn’t one slow LLM call – it’s 6 to 12 calls that compound. Here’s a find-the-bottleneck decision tree and the concrete fixes for each cause.
Why is my AI agent so slow? The one-line answer
Your AI agent is so slow because a single user turn is not one LLM call – it is typically 6 to 12 calls chained together, and latency compounds across all of them. A modest +300ms per call becomes 2 to 4 extra seconds end-to-end, and that is before you add tool round-trips and reasoning-model thinking time.
This is the thing most articles on agent latency miss. They define time to first token (TTFT) as a single metric, or they benchmark raw model speed, or they write an enterprise think-piece about customer experience. None of that helps the builder staring at a 15-second spinner. The reason why your AI agent is so slow is structural: an agent is a loop, and every iteration pays the full latency tax again.
Concretely, agent runtimes issue 6-12 LLM calls per user turn for planning, tool selection, tool-result interpretation, and final synthesis. If each call has a TTFT that creeps up by 300ms – because your context grew, or you switched to a bigger model – you do not pay 300ms once. You pay it 6 to 12 times. That is the 2-4 second swing, and on a 20-step research agent a 3-second TTFT per call is a full minute of waiting.
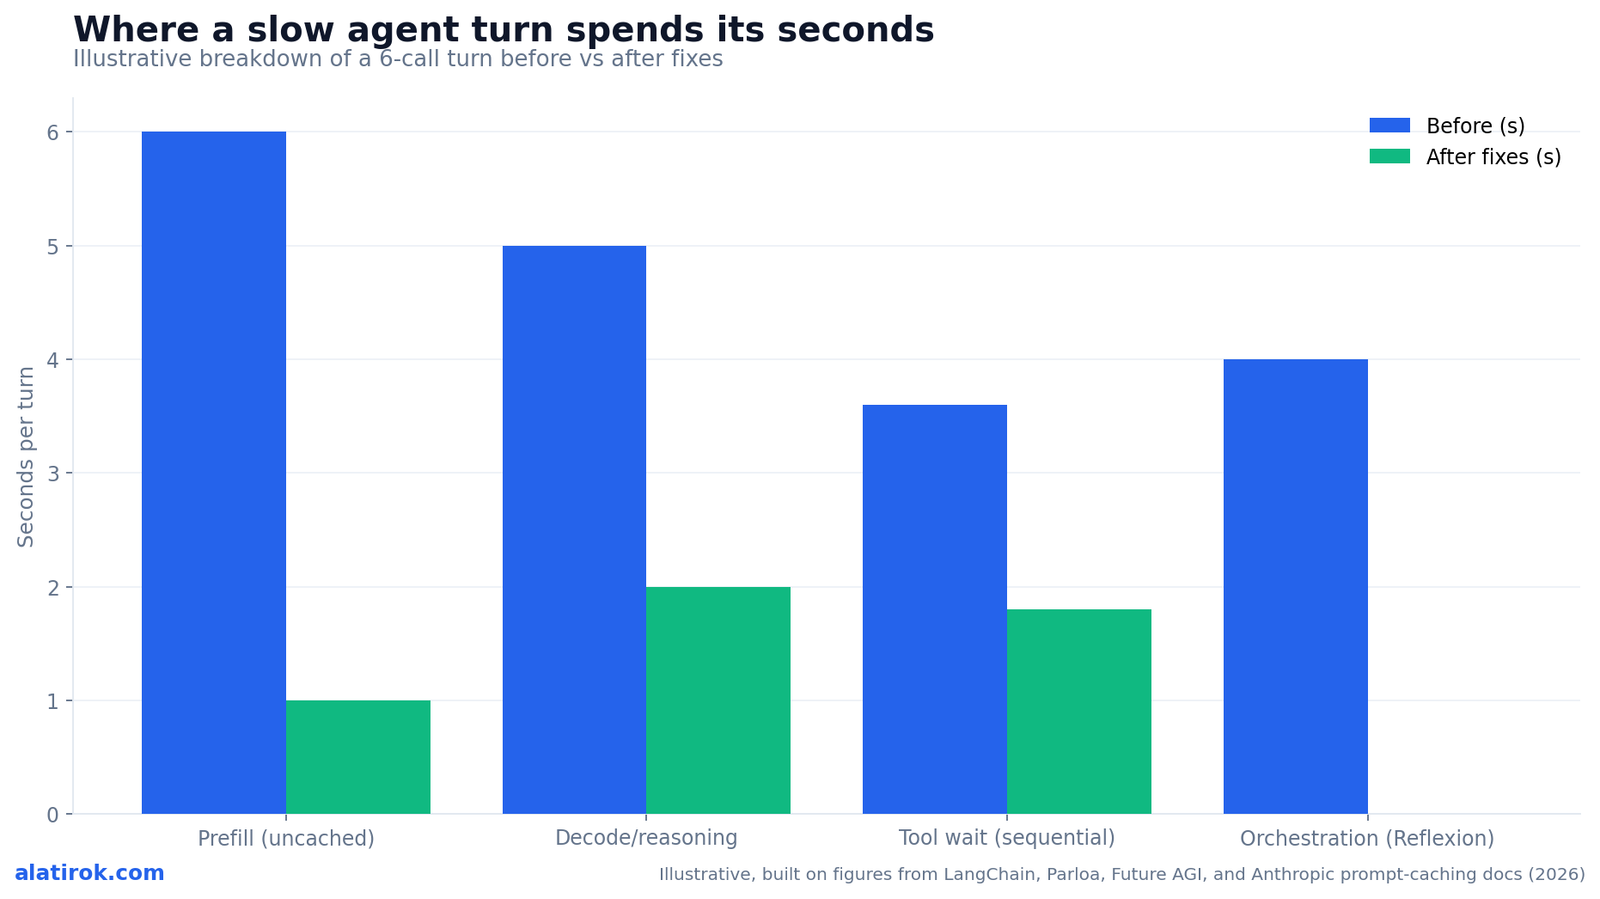
So the diagnostic question is never ‘is my model slow?’ It is ‘which of my four latency layers is slow, and on which step?’ Those four layers – prefill, decode, tool wait, and orchestration – are the entire game. The rest of this guide is a decision tree for finding which one is hurting you and the specific fix for each.
6-12 LLM calls per turn means latency multiplies, not adds once. +300ms/call = +2-4s end-to-end. Always reason about per-turn latency as (per-call latency x number of calls), not as a single response time.
First, measure per-step TTFT (don’t guess the bottleneck)
Before changing anything, capture a waterfall trace of one slow turn and record TTFT and total duration for every individual LLM call and tool call. The bottleneck is almost never where intuition points, and optimizing the wrong layer is the most common mistake.
TTFT is the time from when the model endpoint receives your request to when it emits the first token. It covers tokenization, KV-cache prefill, queue time, and routing. In an agent, you want this number per step, not aggregated – because one step (usually a long-context synthesis or a reasoning call) is typically responsible for most of the wall-clock time.
If you use LangSmith, the waterfall view does this directly. Otherwise, wrap each call and log four numbers: input token count, TTFT, total duration, and output token count. The input token count is the single most diagnostic field, because TTFT scales primarily with prompt length during prefill. A step with 95k input tokens and a 4-second TTFT is a prefill problem; a step with 800 input tokens and a 6-second TTFT is a decode or reasoning problem. Same symptom, opposite fix.
Here is a minimal, runnable instrumentation wrapper you can drop around any call. It separates TTFT from total time so you can classify the bottleneck.
import time
from anthropic import Anthropic

client = Anthropic()

def timed_stream(messages, system, tools=None, model="claude-sonnet-4-6"):
    start = time.perf_counter()
    ttft = None
    out_tokens = 0
    text = []
    with client.messages.stream(
        model=model,
        max_tokens=1024,
        system=system,
        tools=tools or [],
        messages=messages,
    ) as stream:
        for event in stream:
            if event.type == "content_block_delta" and ttft is None:
                ttft = time.perf_counter() - start  # first visible token
            if event.type == "content_block_delta" and getattr(event.delta, "text", None):
                out_tokens += 1
                text.append(event.delta.text)
        final = stream.get_final_message()

    total = time.perf_counter() - start
    in_tokens = final.usage.input_tokens
    cache_read = getattr(final.usage, "cache_read_input_tokens", 0)
    print(f"in={in_tokens} cache_read={cache_read} ttft={ttft:.2f}s "
          f"total={total:.2f}s out_tok~{out_tokens}")
    # Classify: high in_tokens + high ttft  -> prefill
    #           low in_tokens  + high ttft  -> decode / reasoning
return "".join(text), final| What you measure | Likely layer | Tell-tale signal | Jump to fix |
|---|---|---|---|
| High input tokens + high TTFT | Prefill | TTFT grows as context accumulates each turn | Prompt caching / trim context |
| Low input tokens + high TTFT | Decode or reasoning | Small prompt, still slow to first token | Smaller/faster model or router |
| Gap between LLM calls is large | Tool wait | Time spent outside the model, in awaits | Parallel tool calls / cache results |
| Many calls per turn | Orchestration | 6-12+ calls, critic/Reflexion loops | Drop a loop / fewer calls |
Bottleneck 1 – Prefill: long prompts make TTFT explode
If your slow steps have large input token counts, prefill is your bottleneck. TTFT scales with prompt length because the model must process every input token before emitting the first output token – and in agents, context balloons as tool results, history, and retrieved files accumulate every turn.
This is why why your AI agent is so slow gets worse the longer a conversation runs. Turn one sends 3k tokens; turn ten is re-prefilling 90k tokens of accumulated context on every single LLM call in the loop. A ~20k-token context processed from scratch already costs several seconds of TTFT; multiply by the number of calls per turn and you have your spinner.
There are two fixes, and you want both. First, prompt caching. Put your stable, high-volume prefix – system prompt, tool definitions, long reference docs – above a cache breakpoint, and the volatile tail (the current user message, latest tool result) below it. On a cache hit, the model only prefills the new tokens, so generation starts almost immediately. Independent evaluations across providers report TTFT improvements of 13-31% and cost cuts of 41-80%; for long prompts specifically, Anthropic documents latency reductions up to about 85%, and cache reads bill at roughly 0.1x the normal input price.
Second, trim context. Most agents carry dead weight: full tool-call JSON from ten turns ago, redundant retrieved chunks, verbose system scaffolding. The response time is proportional to input length, so summarizing or evicting stale turns is a direct TTFT win. The two work together – cache the part you must keep, delete the part you don’t.
Cache hits require a byte-identical prefix. A single mutable field high in the prompt – a timestamp, a per-request ID, or reordered tool defs – invalidates the cache and you re-prefill from scratch. Keep volatile content strictly below the breakpoint. Naive ‘cache the whole context’ can paradoxically raise latency.
# Cache the stable prefix; leave volatile content uncached below the breakpoint.
system = [
    {"type": "text", "text": LONG_SYSTEM_PROMPT},
    {
        "type": "text",
        "text": TOOL_REFERENCE_DOCS,        # big, stable, reused every turn
        "cache_control": {"type": "ephemeral"},  # <-- breakpoint: everything
    },                                          #     up to here is cached
]
# messages[] (current user turn + latest tool result) stay BELOW the breakpoint
# so only the new tokens are prefilled on a cache hit.
Bottleneck 2 – Decode and reasoning model agent latency
If a slow step has a small prompt but still takes seconds to first token, the model itself is the bottleneck – either it’s oversized for the task, or it’s a reasoning model spending invisible ‘thinking time’ before any user-visible token appears.
Reasoning model agent latency is a distinct and underappreciated cause. The o-series and similar models generate internal chain-of-thought tokens before producing visible output, which can push TTFT into the 2-10+ second range on routine calls and far higher on hard ones – reports cite tens of seconds when a model gets stuck self-correcting. From the user’s seat this looks like a frozen agent, because the thinking tokens are invisible. Roughly 20% of organizations report struggling with reasoning-model response times in customer-facing apps.
The fix is selective model use. You almost never need your most powerful reasoning model for every step in the loop. Use a small, fast router or worker model (Gemini Flash, a Haiku-class model, or a hosted fast endpoint) for cheap decisions – tool selection, classification, formatting – and reserve the big reasoning model for the single step that genuinely needs deep reasoning. This is a latency strategy as much as a cost one.
If you must use a reasoning model, cap and tune the thinking budget. Setting max_tokens too low is its own trap: the reasoning tokens consume the entire budget and you get a length-finish with zero visible output. Set an explicit thinking budget sized to the task, and stream a ‘thinking…’ indicator so perceived latency drops even when actual latency doesn’t.
Pros
Cons
Bottleneck 3 – Tool wait: multi-tool agent slow response
If your trace shows large gaps between LLM calls – time spent outside the model – your bottleneck is tool wait. Every external tool call adds network round-trip, serialization, and queuing delay, and those stack across the chain. A typical support turn can accumulate ~900ms of pure tool latency before the user hears anything.
A multi-tool agent slow response usually comes from four tool-calling anti-patterns. Excessive calls: unclear instructions or over-granular tools make the model issue five or six requests where one would do. Sequential execution: independent calls awaited one after another, doubling latency for no reason. Redundant calls: the same tool invoked twice with identical parameters because the model forgot it already has the answer. And missing caching: hitting an external API repeatedly for static data.
The fixes map one-to-one. Parallelize independent tool calls – if fetching user data and inventory don’t depend on each other, run them concurrently and you cut that segment of the turn roughly in half. Cache tool results for static or slow-changing data so repeat lookups within a turn are free. Batch related operations into one tool that returns everything the model needs. And tighten tool definitions so the model stops over-calling.
Here is the parallel pattern – the single biggest tool-wait win for most agents.
import asyncio

# SLOW: sequential awaits - latency = sum of both round-trips
# user = await get_user(uid)
# inv  = await get_inventory(sku)

# FAST: independent tool calls run concurrently - latency = max(...)
async def gather_context(uid, sku):
    user, inv = await asyncio.gather(
        get_user(uid),
        get_inventory(sku),
    )
    return user, inv

# Most agent SDKs expose a parallel/batch mode for tool calls the model
# requested in the same step - enable it instead of looping awaits.Bottleneck 4 – Orchestration: when the agent loop takes 10 to 30 seconds
If no single step is slow but the turn still takes 10-30 seconds, your bottleneck is orchestration – you simply have too many LLM calls. An Orchestrator-Worker flow with a Reflexion (self-critique) loop routinely takes 10-30 seconds, which is often unacceptable for user-facing support.
This is the agent loop 10 to 30 seconds too slow problem, and it is the hardest for people to see because every individual call looks fine. The cost is in the count. A planner call, a worker call per subtask, a critic call to evaluate, a revision call, then synthesis – each is a full TTFT, and a Reflexion loop adds a round trip every iteration. With 6-12 calls per turn, even a snappy 1.5s per call is 9-18 seconds.
The fix is to cut calls, not speed them up. Drop the Reflexion or critic loop unless an eval proves it materially improves output – it is a 2-4 second tax per turn and frequently changes nothing for simple queries. Collapse multi-agent hand-offs into a single structured call where you can. And move from an open-ended ReAct loop to an explicit graph (LangGraph or similar) where you specify exactly how steps communicate, which routinely produces significantly fewer LLM calls than letting an agent free-run.
To speed up LangGraph agent latency specifically: use conditional edges so cheap queries skip the heavy nodes entirely; run independent nodes (guardrails, parallel retrieval, multi-doc extraction) concurrently; and gate expensive nodes like critics behind a router that only invokes them when the task warrants it. The graph is your lever – it lets you make ‘fewer calls’ a structural property instead of a hope.
The find-the-bottleneck decision tree (and how to reduce agent time to first token)
Run this decision tree top to bottom on your slowest measured step: large input tokens means prefill (cache and trim); small input but slow first token means decode/reasoning (route to a smaller model); large gaps between calls means tool wait (parallelize and cache); too many calls means orchestration (drop a loop). That order is also the order of highest expected payoff for most agents.
To reduce agent time to first token in practice, work from the cheapest, safest fix to the most invasive. Prompt caching is first because it requires no behavior change and pays back across every call in the loop. Context trimming is second. Parallelizing independent tool calls is third. Routing non-reasoning steps to a smaller model is fourth. Dropping a Reflexion or critic loop is last, because it can affect output quality and needs an eval to justify.
Two perception fixes apply at every layer and cost almost nothing: stream tokens so the user sees motion immediately, and surface intermediate progress – thinking indicators, retrieval results, planning steps. For voice and support, the bar is roughly one to two seconds end-to-end, and sub-second for routing; for a background research agent, users tolerate far more if they can see progress. Match the fix to the channel.
Re-measure after each change. The waterfall that found the bottleneck is also how you confirm the fix moved the right number – and how you catch the next bottleneck, which often only becomes visible once you remove the first.
“Latency in an agent is not one slow call you can fix in isolation – it is a tax you pay 6 to 12 times per turn. Find which layer, on which step, then stop guessing.”
Surya Koritala, founder of Cyntr and Loomfeed
| Symptom in your trace | Bottleneck | Primary fix | Expected effect |
|---|---|---|---|
| Input tokens grow each turn, TTFT climbs | Prefill | Prompt caching + trim context | Up to ~85% TTFT cut on long prompts (cache hit) |
| Small prompt, slow first token | Decode/reasoning | Router to smaller model; cap thinking budget | Removes seconds of invisible thinking time per call |
| Idle gaps between LLM calls | Tool wait | Parallel tool calls + result caching | Cuts independent tool segments toward max(), not sum() |
| 6-12+ calls, critic/Reflexion present | Orchestration | Drop loop; explicit graph; conditional edges | Removes a 2-4s/turn tax; fewer calls overall |
Builder’s take
I’ve shipped enough agent latency regressions on Cyntr to have a reflex now: before I touch a single parameter, I look at the per-step waterfall. The mistake almost everyone makes – including me, early on – is optimizing the wrong layer. You swap to a faster model to fix what was actually a prefill problem, and the agent stays slow.
- Measure per-step TTFT before you change anything. The bottleneck is almost never where your gut says it is – on Cyntr it was usually a 90k-token context getting re-prefilled every turn, not the model.
- Prompt caching is the single highest-leverage fix for long-context agents. Stable system prompt and tool defs above the breakpoint, volatile stuff below – we cut perceived latency hard without changing the model.
- Most ‘multi-agent’ slowness is just too many LLM calls. A Reflexion or critic loop that adds one round trip per turn is a 2-4 second tax. Earn it or cut it.
- Parallelize independent tool calls. If two lookups don’t depend on each other and you’re awaiting them in sequence, you’re paying double for nothing.
- Use a small router model for the cheap decisions and save the big reasoning model for the one step that actually needs it. Routing is a latency strategy, not just a cost one.
Frequently asked questions
Because a turn is 6-12 LLM calls, not one. Raw model benchmarks measure a single call; your agent pays that latency repeatedly, plus tool round-trips and any reasoning thinking time. A +300ms per-call regression becomes 2-4 seconds end-to-end. Measure per-step TTFT in a waterfall trace rather than trusting an aggregate or a benchmark.
In order of payoff: enable prompt caching on the stable prefix (system prompt, tool defs), trim accumulated context, parallelize independent tool calls, route non-reasoning steps to a smaller/faster model, and only then consider dropping a critic loop. Caching alone can cut TTFT up to ~85% on long prompts on a cache hit, with no behavior change.
Prefill. TTFT scales with prompt length, and an agent’s context accumulates tool results, history, and retrieved files every turn. By turn ten you may be re-prefilling 90k+ tokens on every call in the loop. Cache the stable portion above a breakpoint and evict or summarize stale turns to stop the growth.
Often, yes. Reasoning models generate invisible chain-of-thought tokens before any visible output, pushing TTFT into the 2-10+ second range and sometimes far higher. Use a smaller model for cheap steps, reserve the reasoning model for the one step that needs it, cap the thinking budget, and stream a thinking indicator so the user sees progress.
Too many LLM calls. An Orchestrator-Worker flow with a Reflexion self-critique loop routinely lands in the 10-30 second range because each call is a full TTFT and the loop adds round trips. Drop the critic loop unless an eval proves it helps, collapse hand-offs, and use an explicit graph to enforce fewer calls.
Use the LangSmith waterfall to find the slow node, then: add conditional edges so cheap queries skip heavy nodes, run independent nodes (guardrails, parallel retrieval) concurrently, gate expensive nodes like critics behind a router, and reduce total LLM calls by specifying exactly how nodes communicate. Pair this with prompt caching on stable prefixes.
Primary sources
- AI Agent Latency 101: How do I speed up my agent? — LangChain
- What Is Agentic AI Latency? How It Impacts Enterprise CX — Parloa
- What Is Time to First Token (TTFT)? — Future AGI
- Time to First Token (TTFT) — IBM
- Prompt caching documentation — Anthropic
- Don’t Break the Cache: An Evaluation of Prompt Caching for Long-Horizon Agentic Tasks — arXiv
- Why Bad Tool Calling Makes LLMs Slow and Expensive — CodeAnt AI
- Thinking Tokens Trap: How Reasoning Models Burn max_tokens — TokenMix
Last updated: June 6, 2026. Related: Observability.