
The failure-rate headlines miss the real story. Here is the compounding-error math that explains why a 95%-per-step agent collapses to a coin flip, and the step-count threshold where adding capability tanks end-to-end success.
What is the AI agent error rate compounding problem?
The AI agent error rate compounding problem is the mathematical fact that end-to-end reliability is the product, not the average, of per-step reliability. A 95%-per-step agent does not stay at 95% across a workflow. Over 20 steps it lands at 0.95^20, which is roughly 36% end-to-end success. That single line of arithmetic explains most of what people mean when they ask why AI agents fail in production.
Every failure-rate listicle in 2026 leads with a scary headline number. Fiddler AI reports production agent failure rates of 70-95%. One widely shared analysis of 847 deployments found 76% failed within the first 90 days. Industry surveys put roughly 88% of agent projects as failing to reach production at all. Those numbers are real and we will use them. But they all describe failure as a single project-level statistic, a flat percentage you read off a slide. None of them build the model that explains the mechanism.
The mechanism is multiplication. If a step succeeds with probability p, and steps fail independently, then a chain of N steps succeeds with probability p^N. Because p is less than one, raising it to a power drives the result toward zero, and it does so exponentially. This is not an AI-specific law. It is the same series-reliability principle Robert Lusser formalized for missile systems in the 1950s: a system in series is only as reliable as the product of its parts. Sequential dependencies, as one 2026 analysis put it, do not care about the substrate.
So the right question is never just how reliable is my agent. It is: how reliable is each step, how many steps am I chaining, and where on the exponential curve does that put me? The rest of this article builds that curve from real, cited numbers, ties it to rollback rates and dollars, and gives you the threshold where adding a tool or a step stops helping and starts hurting.

Why do AI agents fail in production? The compounding math, step by step
AI agents fail in production because each added step multiplies a less-than-one success probability, so reliability decays exponentially with workflow length, not linearly. The intuition that 95% is “good enough” is exactly backwards once you chain steps.
Work the arithmetic by hand and the collapse is obvious. Start with a genuinely strong agent at 95% per-step accuracy. Chain two steps: 0.95 x 0.95 = 90.3%. Five steps: 0.95^5 = 77.4%. That last figure is the one MindStudio highlighted in 2026 when they showed that chaining five agents at 95% reliability drops you to 77% end-to-end. Keep going: ten steps gives 59.9%, and twenty steps gives 35.8%. Your 95%-reliable agent is now wrong about two times out of three on a realistic workflow.
Drop to 90% per step, which several practitioners argue is closer to reality for agents juggling variable inputs, flaky external APIs, rate limits, and ambiguous instructions. Now five steps lands at 59%, ten steps at 34.9%, and twenty steps at 12.2%. At 85% per step, a figure Fiddler and others treat as plausible for hard tasks, eight steps gives 0.85^8 = 27.2% and ten steps gives just 19.7%. An 85%-accurate agent fails four out of five times on a ten-step task.
Two anchor points are worth memorizing because they appear across the 2026 literature. First, 0.85^8 is approximately 27% — an agent that is right 85% of the time at each of eight steps gets the whole workflow right only about a quarter of the time. Second, 0.95^20 is approximately 36% — even near-excellent per-step accuracy buys you only a coin flip’s worth of reliability once the chain gets long. These are not pessimistic edge cases. They are the median experience of teams who built an impressive demo and watched it disintegrate the moment the workflow grew.
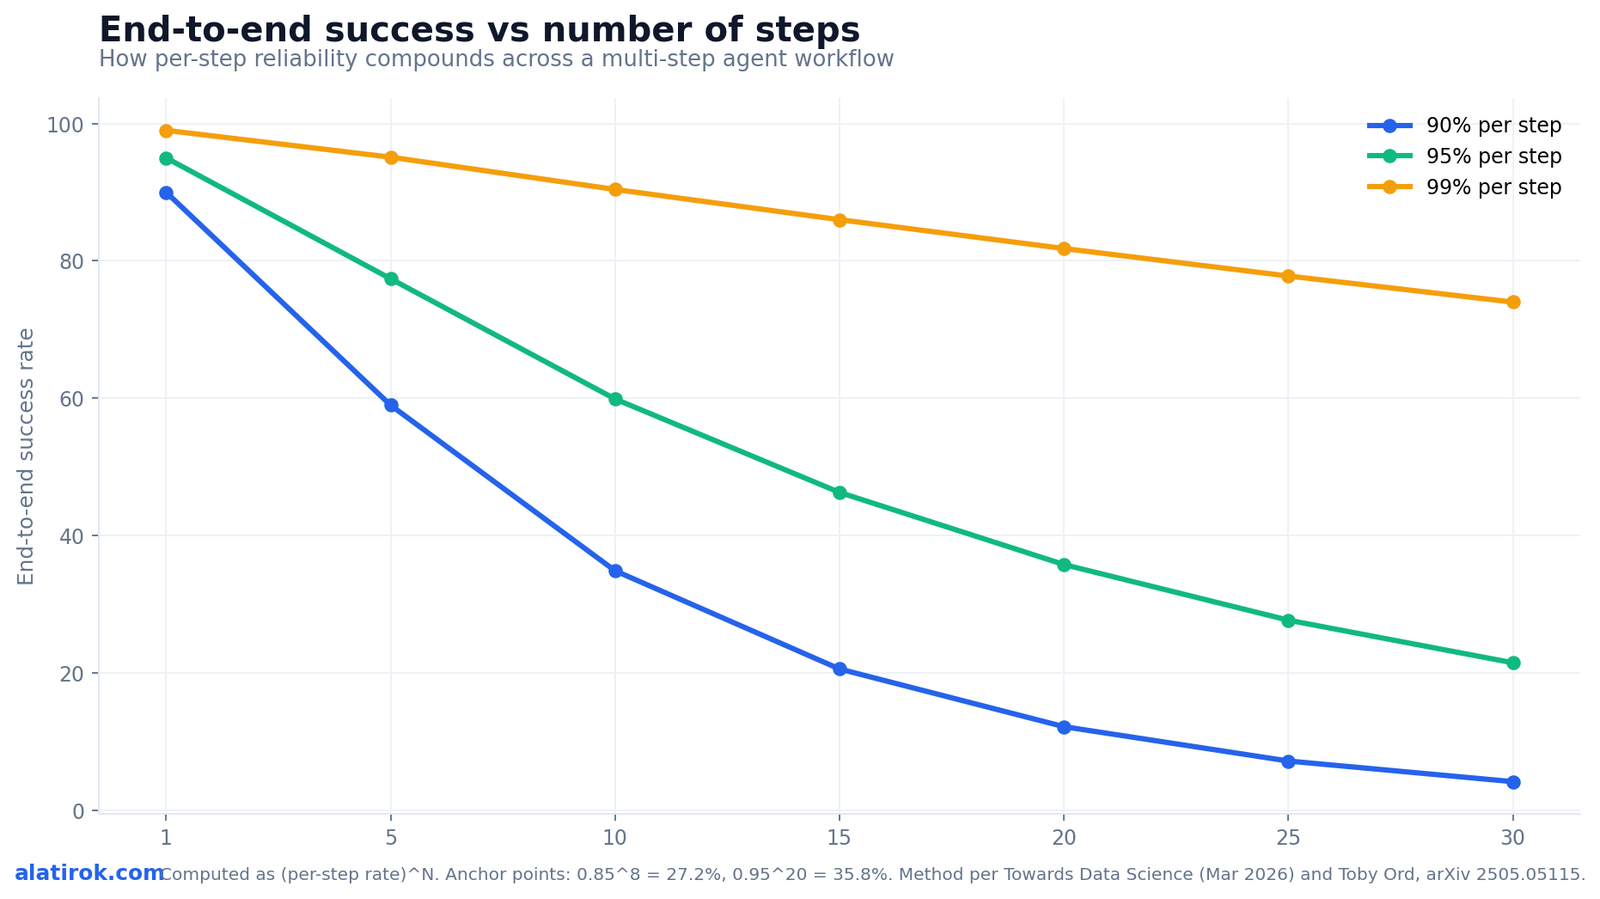
End-to-end success = (per-step success rate) ^ (number of steps). If you double the task length, you roughly square the success probability. That is why a 99%-per-step agent over 30 steps still drops to 74%, and a 90%-per-step agent over 30 steps falls to 4%.
Multi-step agent reliability math: the reliability-vs-step-count curve
The reliability-vs-step-count curve is the single chart every agent builder should have on the wall. It plots end-to-end success against number of steps for 90%, 95%, and 99% per-step reliability, and it shows that step count, not raw model quality, is usually the dominant variable.
Read the curve and three things jump out. The 90% line is already in trouble by step 10 (34.9%) and effectively dead by step 20 (12.2%). The 95% line looks healthy early but crosses below 50% somewhere between step 13 and step 14, then keeps sliding to 35.8% at step 20. Only the 99% line stays in deployable territory for long horizons, holding 81.8% at step 20 and 74% at step 30. The gap between 95% and 99% per step looks tiny in isolation; on a 20-step task it is the difference between a coin flip and a system you can actually run.
This reframes the whole reliability conversation. Teams instinctively reach for a better model to fix a failing agent. But moving from 95% to 99% per step is enormously hard — it is a frontier-research problem. Cutting a 20-step workflow to 10 steps is an architecture decision you can make this afternoon, and it moves you from 36% to 60% end-to-end at 95%, or from 12% to 35% at 90%. Shortening the chain is almost always the higher-leverage move than chasing per-step accuracy. The academic backing for the curve’s shape comes from Toby Ord’s 2026 analysis, which models agent success with a constant per-unit-time hazard rate, yielding an exponentially declining success rate and a neat rule of thumb: double the task duration and you square the success probability.
Per-step success rate vs end-to-end reliability: the numbers in a table
The table below converts the curve into the exact figures you need for capacity planning. Find your honest per-step accuracy on the left, your step count across the top, and read your real end-to-end success rate. Most production disappointments are explained by a single cell in this grid.
Two notes on using it honestly. First, your per-step rate must be measured, not assumed — and it must be measured on production-like inputs, not the happy-path demo. Demo accuracy is almost always inflated. Fiddler cites a case where single-run success was 60% but success across eight consecutive runs collapsed to 25%, precisely because variance compounds. Second, these figures assume independent failures. Real failures are sometimes correlated (a bad upstream value poisons everything downstream), which can make things worse, not better, since one early error silently invalidates every step after it without tripping an exception.
| Per-step accuracy | 3 steps | 5 steps | 8 steps | 10 steps | 20 steps |
|---|---|---|---|---|---|
| 99% | 97.0% | 95.1% | 92.3% | 90.4% | 81.8% |
| 95% | 85.7% | 77.4% | 66.3% | 59.9% | 35.8% |
| 90% | 72.9% | 59.0% | 43.0% | 34.9% | 12.2% |
| 85% | 61.4% | 44.4% | 27.2% | 19.7% | 3.9% |
| 70% | 34.3% | 16.8% | 5.8% | 2.8% | 0.1% |
AI agent failure rate production 2026: tying the math to rollbacks and dollars
36%
End-to-end success at 0.95^20
A 95%-per-step agent over 20 steps
47% vs 9%
Rollback rate, no evals vs full evals
Forrester 2026 panel, via Digital Applied
76%
Of 847 tracked deployments failed
Within the first 90 days, 2026 analysis
~49 pts
Embedded-vs-production gap
80% of apps embed agents; ~31% in production
The compounding curve is not academic. It maps directly onto the 2026 production failure statistics: 70-95% of agents fail in real environments per Fiddler, roughly 88% of projects never reach production, and one 847-deployment analysis found 76% failed within 90 days. Compounding error is the dominant mechanism behind those headline numbers.
The dollar consequence shows up in rollback rates. In a 2026 Forrester panel reported by Digital Applied, agents without automated evals had a 47% rollback rate over the prior year, versus 9% for agents with full eval coverage — a more than 5x difference. The same data noted that only 38% of production agents run automated evals on every prompt change, and called eval coverage the single most predictive indicator of whether an agent is still in production twelve months later. Evals matter precisely because of compounding: without per-step evaluation, you cannot see which step is dragging your p down, so you cannot tell whether your 36% end-to-end number comes from one broken step at 50% or twenty mediocre steps at 95%.
There is a market-level version of the same gap. As of Q1 2026, roughly 80% of enterprise apps shipped or updated embed at least one AI agent, but only about 31% of enterprises have an agent actually running in production. That ~49-point gap is where most enterprise AI dollars — and most of the year’s quiet write-offs — are concentrated. Read through the compounding lens, the gap is not mysterious: teams shipped agents whose workflows were too long for their per-step reliability, the math caught up with them in production, and the rollback rate did the rest.
“You cannot average your way out of a product. End-to-end reliability is the multiplication of every step, and multiplication of numbers below one only goes one direction.”
The compounding-error principle, applied to agents
What is the step-count threshold where adding tools tanks success?
The practical threshold is wherever your end-to-end success crosses below your acceptable floor. For a typical 95%-per-step agent that floor of 50% arrives at about 13-14 steps; for a 90%-per-step agent it arrives at about 6-7 steps; for an 85%-per-step agent it arrives at about 4-5 steps. Past that point, every tool or step you add is net-negative.
This is the counterintuitive part for builders who equate capability with more tools and more steps. Each new tool you wire in is another factor in the product. If your steps run at 90% and you are already at step 7 (47.8% end-to-end), adding an eighth step multiplies you by another 0.9 down to 43% — you added a capability and lost reliability. The agent can now do more things and complete fewer workflows. This is the same ceiling our companion analyses of agent failure modes and the practical tool limit describe from the qualitative side; the compounding math is the quantitative reason those ceilings exist.
The escape routes are all about changing the math rather than fighting it. Raise per-step accuracy with tighter prompts, narrower tools, and validation gates so a step that would have been 90% becomes 98%. Cut step count by collapsing multiple tool calls into one deterministic function, or by removing steps the workflow does not truly need. Break sequential dependence: run independent sub-tasks in parallel so they do not multiply, and add retries at each step so a single 95% step effectively becomes 1-(0.05^2) = 99.75% on two attempts. And put human-in-the-loop or deterministic checkpoints at irreversible boundaries, which truncates the chain into shorter, independently-verified segments instead of one long fragile product.
Pros
Cons
Cutting a 20-step workflow to 10 steps moves a 95%-per-step agent from 36% to 60% end-to-end. That is a bigger reliability gain than almost any model upgrade can buy you, and you can ship it today.
How reliable are AI agents, really, and how do you raise the number?
Reliability is multiplied, not averaged — engineer the formula
Honestly measured on production-like inputs, most 2026 agents run at 85-95% per step, which is why long-chain workflows routinely land between 12% and 60% end-to-end. The path to reliable agents is to engineer the two variables in the formula — raise per-step accuracy and cut step count — rather than wait for a better model.
Start by instrumenting per-step accuracy. You cannot manage a product term whose factors you cannot see, so run automated evals on every step and every prompt change; the 47%-vs-9% rollback gap is the price of skipping this. Then attack the formula on both sides. On the accuracy side: narrow each tool’s surface area, constrain outputs with schemas, and add cheap validators that catch a bad step before it propagates. On the length side: ruthlessly prune steps, fold deterministic logic out of the LLM entirely, and parallelize anything independent so it adds rather than multiplies.
Finally, design for partial failure. Add retries at each step (a single retry turns a 95% step into ~99.75%), checkpoint at irreversible actions so a long chain becomes a series of short verified segments, and prefer architectures where a wrong step is cheap and recoverable rather than catastrophic. The teams whose agents are still running twelve months later are not the ones with the smartest models. They are the ones who respected the compounding math, kept their chains short, measured every step, and put gates where being wrong was expensive. The math is unforgiving, but it is also a design spec — and that is the most useful thing about it.
Builder’s take
I build agents for a living at Cyntr and Loomfeed, and the compounding-error curve is the single most useful mental model I have for deciding what to ship. Here is what it changed in how we operate.
- We treat step count as a budget, not a feature. Every tool call we add to a Cyntr workflow has to earn its place against the multiplier it costs us on end-to-end reliability. Most don’t.
- We measure per-step accuracy in isolation before we ever chain. If a single step can’t clear ~98% on its own evals, chaining it is just laundering an error rate into a worse one.
- We put hard checkpoints at irreversible boundaries. Posting, paying, and deleting get a human or a deterministic gate. Everywhere else, the agent can be wrong cheaply and retry.
- The 47% vs 9% rollback gap is the cheapest insurance in the business. Eval coverage on every prompt change is unglamorous and it is the thing that keeps an agent alive past month three.
- Shorter beats smarter, almost every time. Cutting a 12-step plan to 6 steps buys more reliability than a model upgrade, and it ships today.
Frequently asked questions
It is the fact that an agent’s end-to-end success rate equals its per-step success rate raised to the number of steps (rate^N), not the per-step rate itself. Because each step’s probability is below one, success decays exponentially as the chain gets longer. A 95%-per-step agent over 20 steps succeeds only about 36% of the time (0.95^20 = 0.358).
The dominant reason is compounding error: real workflows chain many steps, and multiplying many sub-one probabilities collapses end-to-end reliability. Fiddler AI reports 70-95% production failure rates driven by compounding errors, tool breakdowns, and silent hallucinations. Demos use short, happy-path tasks where the math is forgiving; production uses longer, messier tasks where it is not.
It means a workflow of 20 sequential steps, each succeeding 95% of the time, succeeds end-to-end only about 35.8% of the time. It is the canonical example of why near-excellent per-step accuracy is not enough on long chains — even small per-step error rates compound into majority failure.
It depends on per-step accuracy and your acceptable success floor. At a 50% end-to-end floor: a 95%-per-step agent crosses it around step 13-14, a 90%-per-step agent around step 6-7, and an 85%-per-step agent around step 4-5. Past that threshold, adding a step lowers end-to-end success even though it adds capability.
Reducing steps is usually the higher-leverage move because it is an architecture decision you can make immediately, whereas pushing per-step accuracy from 95% to 99% is a frontier-research problem. Cutting a 20-step workflow to 10 steps moves a 95%-per-step agent from 36% to 60% end-to-end. In practice you do both: prune steps, parallelize independent work, and add validators and retries to raise per-step accuracy.
Rollback rate is how often deployed agents get pulled back or reverted. A 2026 Forrester panel reported a 47% rollback rate for agents without automated evals versus 9% for agents with full eval coverage. The link to compounding is direct: without per-step evals you cannot see which step is dragging down your end-to-end success, so failures accumulate silently and force rollbacks.
Primary sources
- AI Agent Failure Rate: Why 70-95% Fail in Production — Fiddler AI
- The Math That’s Killing Your AI Agent — Towards Data Science
- Multi-Agent Reliability Math: Why Chaining 5 Agents Drops Success Rate to 77% — MindStudio
- Is there a Half-Life for the Success Rates of AI Agents? — Toby Ord / arXiv
- AI Agent Adoption 2026: 120+ Enterprise Data Points — Digital Applied
- I Analyzed 847 AI Agent Deployments in 2026. 76% Failed. — Snehal Singh (Medium)
Last updated: June 2, 2026. Related: Observability.