
7 recurring production failure modes now show up across agent deployments: swallowed tool errors, fabricated tool arguments, context loss, retry loops, false completion, expired credentials, and real-world data drift. This list matters because teams are moving from toy demos to systems that touch tickets, code, CRM records, and internal workflows. If you are building or operating agents, the practical question is no longer whether they can act, but whether you can see when they act badly. For related coverage, see our LangSmith production observability guide and our roundup of AI agent evaluation tools.
Why this list matters now
The production problem with agents is not that they fail; every software system fails. The problem is that agent failures often look like plausible work. A conventional service throws a visible exception, returns a 500, or trips an alert. An agent can hit a tool error, lose context, or skip a required action and still produce a polished natural-language answer that sounds complete. That gap between apparent competence and actual execution is what makes AI agent failure modes operationally expensive.
The seven patterns below are concrete because they map to things teams can instrument: traces, tool-level status codes, argument validation, auth freshness checks, loop counters, and eval datasets built from real production traffic. If you are still early, start with observability and replay. If you are already shipping, pair this list with multi-agent observability, agent evaluation tooling, and your own incident review process.
Treat every agent response as a claim about external state until a trace, tool result, or downstream system confirms it.
“The most dangerous agent failures are the ones that still sound helpful.”
Alatirok editorial view
1. Silent tool-call failures — The highest-risk failure mode because the agent keeps talking after the action path already broke.
Best place to start: instrument tool failures first
This is the production classic: the agent calls a tool, the tool errors, and the failure is swallowed somewhere between the model, the orchestration layer, and the final user-facing response. The user gets a confident answer built on missing or stale data. In support and operations workflows, that can mean fabricated ticket updates, nonexistent order changes, or summaries generated from partial retrieval.
Signal or symptom: traces show a tool exception or non-200 response, but the final answer contains no uncertainty and no mention of the failed step. You may also see a mismatch between tool success rate and user-reported completion rate.
Why it happens: many agent stacks optimize for graceful degradation. That is reasonable for search or retrieval, but dangerous for action-taking systems. If the framework treats tool errors as recoverable context instead of hard blockers, the model may continue reasoning over an empty result. Teams also miss this when they log only final outputs rather than intermediate tool spans.
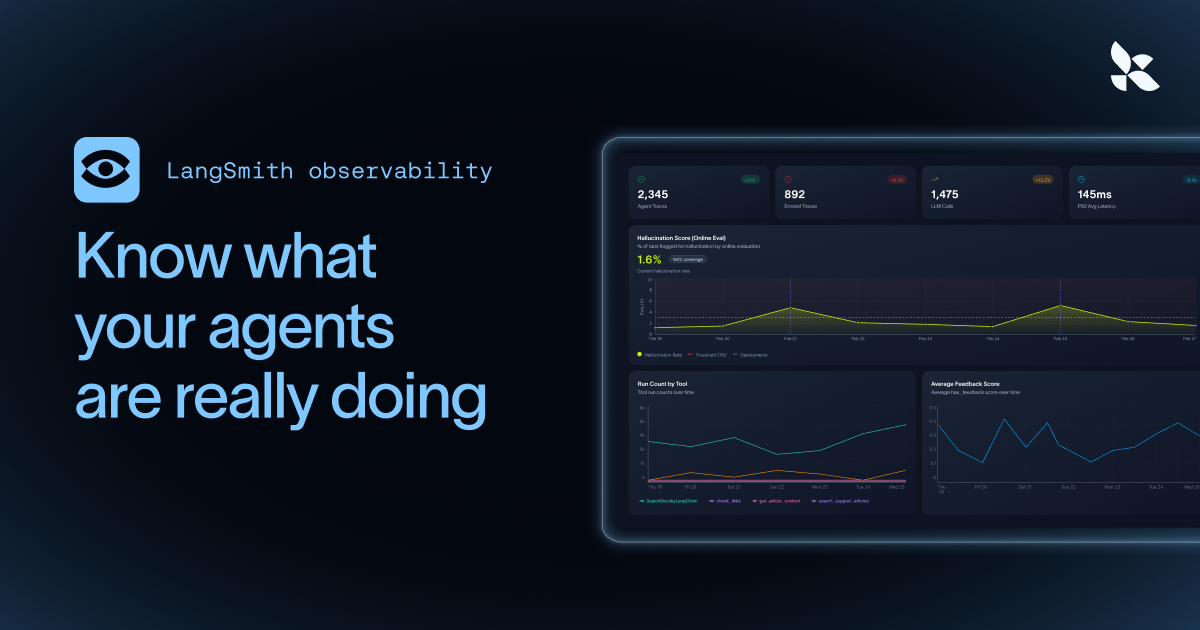
How to detect it: require structured tool result envelopes with explicit success or failure fields, trace every tool invocation, and add assertions that block final completion when mandatory tools fail. LangSmith documents tracing and debugging for LLM applications and agents, which is why it is frequently used as the first layer of production visibility for these cases. OpenTelemetry also gives teams a standard way to emit spans and attributes across services, making it easier to correlate agent runs with backend failures. For related Alatirok coverage, see our LangSmith setup guide, our evaluation tools roundup, and our look at agent frameworks.
Silent tool-call failures ⭐ Editor’s Pick
Best for: Teams prioritizing first-line production instrumentation and incident prevention
What works
Watch out for
{
  "tool": "update_ticket",
  "success": false,
  "status_code": 503,
  "error": "upstream timeout",
  "retryable": true,
  "output": null
}
2. Hallucinated tool arguments — The tool is real, but the payload is invented.
A model does not need to invent a fake tool to cause damage. It can call a legitimate tool with fabricated IDs, malformed dates, guessed field names, or values copied from the wrong part of the conversation. This is one of the easiest failure modes to miss because the call itself looks valid at the infrastructure layer.
Signal or symptom: the tool invocation succeeds syntactically but returns empty, wrong, or low-confidence results. In action systems, you may see updates applied to the wrong record or no-op writes against nonexistent entities.
Why it happens: language models are pattern completers. If the prompt implies that a customer ID, invoice number, or repository name should exist, the model may infer one rather than ask for clarification. Weak schemas make this worse. If your tool accepts free-form strings where enums, regex constraints, or typed IDs should exist, the model has too much room to guess.
How to detect it: validate arguments before execution, use strict schemas, and compare tool arguments against source-of-truth entities. OpenAI’s function calling and structured outputs guidance has pushed the ecosystem toward schema-constrained calls, but teams still need application-level validation. In practice, the best detector is a preflight layer that checks whether referenced entities exist and whether the arguments were copied from user input, retrieved context, or model inference. If the answer is inference, force a clarification step instead of execution.
Hallucinated tool arguments
Best for: Teams exposing internal APIs or business actions to agents
What works
Watch out for
Log argument provenance: user-provided, retrieved, cached, or model-inferred. Model-inferred arguments deserve extra scrutiny.
from pydantic import BaseModel, Field

class RefundRequest(BaseModel):
    order_id: str = Field(pattern=r"^ord_[A-Za-z0-9]+$")
    amount_cents: int = Field(gt=0)
    reason: str


def validate_and_execute(payload: dict):
    req = RefundRequest.model_validate(payload)
    if not order_exists(req.order_id):
        raise ValueError("unknown order_id")
    return issue_refund(req.order_id, req.amount_cents, req.reason)
3. Context-window overflow — The agent forgets the instruction that mattered most.
Long-running threads, multi-step plans, retrieval dumps, and verbose tool outputs all compete for the same context budget. Once the important instruction falls out of the active window or gets diluted by later content, the agent starts optimizing for the most recent text rather than the governing objective.
Signal or symptom: the agent follows the latest user turn but ignores earlier constraints such as approval requirements, formatting rules, or prohibited actions. Another clue is inconsistent behavior across otherwise similar long conversations.
Why it happens: context windows are large in 2026, but not infinite, and effective attention is not the same as raw token capacity. Teams often overstuff prompts with full transcripts, repeated system instructions, and retrieval chunks that are only loosely relevant. Multi-agent systems can amplify this by passing verbose summaries between workers.
How to detect it: track prompt size, retrieval volume, and instruction retention in evals. Build tests where critical instructions appear early and see whether the agent still obeys them after several tool turns. Summarization checkpoints, memory compaction, and explicit state objects help more than simply buying a larger context window. This is also where framework choice matters; if your orchestration layer makes state transitions explicit, it is easier to preserve the few fields that truly govern behavior. See also our coverage of memory patterns for stateful agents.
Context-window overflow
Best for: Teams running long-lived support, research, or coding agents
What works
Watch out for
4. Loop traps — The agent keeps retrying the same broken plan because it mistakes persistence for progress.
Agents are often encouraged to reflect, retry, and self-correct. That is useful until the system cannot recognize that each retry is functionally identical to the last one. Then you get loop traps: repeated tool calls against the same failing endpoint, repeated reformulations of the same search, or repeated attempts to satisfy an impossible constraint.
Signal or symptom: a run contains near-duplicate tool calls, repeated chain-of-thought summaries, or escalating token consumption with no new external evidence. User-facing latency and cost rise while task completion stays flat.
Why it happens: retry logic is usually local, while progress is global. The model sees a failed step and tries again, but the orchestrator lacks a strong notion of novelty or state advancement. Some frameworks also make it easy to add retries without adding termination criteria.
How to detect it: set loop counters, compare consecutive actions for semantic similarity, and define explicit stop conditions such as maximum retries per tool, maximum identical search queries, or required evidence thresholds before another attempt. This is where traces and evals work together: traces show the loop, evals tell you whether your stop policy catches it. For adjacent reading, see our framework comparison and our evaluation tooling guide.
Loop traps
Best for: Teams operating multi-step agents with retries and planning loops
What works
Watch out for
A loop trap is not just a reliability issue. It is also a latency and spend issue, especially when each retry triggers retrieval, tool calls, or premium model usage.
# Example policy knobs
MAX_TOOL_RETRIES=2
MAX_IDENTICAL_SEARCHES=2
MAX_TOTAL_STEPS=12
REQUIRE_NEW_EVIDENCE=true
5. Hallucinated success — The agent says the work is done, but nothing changed in the real system.
Runner-up risk: false completion claims
This is the failure mode executives understand immediately because it maps to a broken business promise. The agent reports that the ticket was closed, the refund was issued, the calendar invite was sent, or the deployment completed. The external system says otherwise.
Signal or symptom: user-visible completion messages do not match downstream state. You may also see a suspiciously high completion rate in conversation logs paired with low confirmation rates in the target system.
Why it happens: the model is rewarded for producing a coherent final answer, not for proving that a side effect occurred. If your architecture lets the natural-language response render before write confirmation returns, or if the tool wrapper does not expose authoritative postconditions, the model can overclaim completion.
How to detect it: separate intent from confirmation. The agent can say it attempted an action only after the tool call starts, and it can say the action succeeded only after a verifiable postcondition is checked. For writes, that means reading back the changed record, checking a returned object ID, or verifying a status transition. This is one of the strongest arguments for designing agents around state machines rather than free-form chat transcripts. If the state transition did not happen, the task is not done.
Hallucinated success
Best for: Teams shipping action-taking agents into customer or employee workflows
What works
Watch out for
“Completion is not a sentence the model writes. It is a state transition you can verify.”
Alatirok editorial view
6. Authentication drift — Cached credentials expire, scopes change, and the agent keeps acting like access still exists.
Authentication drift is less glamorous than hallucination, but it is a frequent source of production breakage. Agents often rely on cached tokens, delegated credentials, or long-lived sessions across tools. Those credentials expire, lose scopes, or become invalid after policy changes. The agent may continue planning as if the integration is healthy.
Signal or symptom: tools begin returning 401 or 403 responses after a period of normal operation, often clustered around token expiry windows or permission changes. The final response may still suggest the action was attempted successfully if the auth error is swallowed.
Why it happens: auth state lives outside the model, but many agent architectures do not surface it prominently in planning. The model sees a tool name and assumes capability; the runtime knows the token is stale only at execution time. If refresh logic is brittle or hidden inside a connector, the failure can look intermittent and hard to reproduce.
How to detect it: monitor auth-related error codes separately, attach credential freshness metadata to traces, and force capability checks before high-value actions. OAuth providers and API docs are clear that access tokens expire and scopes govern access, but agent systems still need explicit preflight checks and refresh paths. In practice, auth drift deserves its own dashboard because it behaves more like integration reliability than model quality.
Authentication drift
Best for: Teams integrating agents with SaaS tools, internal APIs, and delegated user actions
What works
Watch out for
{
  "tool": "create_calendar_event",
  "capability_check": {
    "authenticated": false,
    "reason": "access_token_expired",
    "expires_at": "2026-05-20T14:00:00Z"
  },
  "execution_blocked": true
}
7. Distribution shift — The agent looked great in dev and then met real users, real mess, and real edge cases.
Distribution shift is the broadest failure mode on this list, but it is also the one that most often explains the gap between a successful pilot and a disappointing rollout. The agent was tested on clean prompts, cooperative users, and representative-but-small datasets. Production brings abbreviations, contradictory instructions, malformed records, stale documents, and workflows that do not match the happy path.
Signal or symptom: benchmark or staging performance looks healthy, but production completion, accuracy, or containment drops sharply. Error clusters appear around customer segments, document types, or edge-case workflows that were underrepresented in testing.
Why it happens: eval sets are usually too tidy. Teams build them from handpicked examples or synthetic data, then overfit prompts and policies to those examples. Real traffic has different language, different timing, and different incentives. Retrieval quality also shifts when the corpus grows or gets noisier.
How to detect it: continuously sample production traces, label failures, and feed them back into evals. The key is not just more evaluation, but representative evaluation. Slice metrics by user segment, task type, and data source. If your eval harness cannot replay real production cases, it will miss the exact conditions that matter. This is why the strongest agent teams treat observability and evaluation as one loop rather than two separate functions. For more, see our evaluation tools roundup and our piece on synthetic data limits for agent evals.
Distribution shift
Best for: Teams moving from proof-of-concept to broad production rollout
What works
Watch out for
The fastest way to improve eval quality is to seed it with real failed traces from production, then keep refreshing the set as traffic changes.
How to spot these failures before users do
Bottom line: reliability starts with visibility
Across all seven failure modes, the detection stack is surprisingly consistent. First, trace every step: prompts, tool calls, arguments, outputs, retries, and final responses. Second, define task-specific assertions: required tools must succeed, writes must have postconditions, auth must be fresh, and retries must produce new evidence. Third, replay production traces through an eval harness so your test set evolves with reality rather than with your imagination.
This is also where teams should resist the temptation to treat agent quality as a single score. A system can be strong on answer quality and weak on action reliability. It can be robust on short tasks and fragile on long sessions. It can pass synthetic evals and fail on messy enterprise data. Slice-level metrics matter more than vanity averages.
If you need a practical sequence, start with observability, then add hard runtime checks, then build evals from failures. That ordering tends to produce faster reliability gains than trying to perfect prompts in isolation.
Pros
Cons
| Failure mode | Primary signal | Why it happens | Best first detector |
|---|---|---|---|
| Silent tool-call failures | Tool error with confident final answer | Runtime swallows exception and model continues | Step-level tracing with mandatory-tool assertions |
| Hallucinated tool arguments | Valid call, wrong payload | Model infers missing IDs or fields | Schema validation plus entity existence checks |
| Context-window overflow | Earlier constraints ignored | Critical instructions fall out of active context | Instruction-retention evals on long threads |
| Loop traps | Repeated near-identical actions | Retries lack novelty or stop criteria | Loop counters and semantic action diffing |
| Hallucinated success | Agent reports completion without state change | No postcondition verification | Read-after-write confirmation checks |
| Authentication drift | 401/403 after prior success | Expired tokens or changed scopes | Capability preflight and auth telemetry |
| Distribution shift | Dev metrics strong, prod metrics weak | Eval set not representative of real traffic | Production-trace replay and sliced evals |
What to prioritize in the next 30 days
Warning: prompt tuning is not enough
If your team is already in production, do not try to solve every failure mode at once. Pick the ones with the highest business blast radius. For most teams, that means silent tool-call failures, hallucinated success, and authentication drift first, because they directly affect whether the agent can safely act in external systems.
Then build a small but brutal eval set from real incidents. Include expired credentials, malformed IDs, long conversations, repeated retries, and messy production records. Run it on every prompt or orchestration change. This is where the discipline of software engineering needs to reassert itself over demo culture: reproducibility beats vibes.
Finally, make ownership explicit. Some of these failures belong to prompt design, but many belong to runtime engineering, integration reliability, and product policy. If everyone owns agent quality, nobody owns the incident.
Frequently asked questions
A strong candidate is the swallowed or silent tool failure, where a tool errors but the agent still returns a polished answer. Teams usually catch it only after adding step-level traces and tool status checks. LangSmith documents tracing and debugging for agent applications at https://www.langchain.com/langsmith.
Use postcondition verification. Do not trust the model’s completion message by itself; verify the downstream state change by reading back the record, checking an object ID, or confirming a status transition in the target system. OpenTelemetry can help correlate the agent run with backend events: https://opentelemetry.io/.
That is usually distribution shift. The eval set is too clean, too synthetic, or too narrow compared with production traffic. The fix is to replay and label real production traces, then slice metrics by task type and user segment. For background on evaluation tooling, see our AI agent evaluation tools guide.
It helps, but it does not eliminate the problem. Schema-constrained calls reduce malformed payloads, yet teams still need application-level checks such as entity existence validation and permission checks. OpenAI’s developer documentation covers function calling and structured outputs at https://platform.openai.com/docs/guides/function-calling.
Primary sources
- LangSmith — LangChain
- OpenTelemetry — OpenTelemetry
- OpenAI function calling guide — OpenAI
- OAuth 2.0 Framework — IETF
- Pydantic documentation — Pydantic
Last updated: May 21, 2026. Related: Observability.