Only 14% of enterprise AI agent pilots reach org-wide production. Here is the real graduation rate by sector, and the five gaps behind the 88% failure stat.
What is the AI agent pilot to production rate 2026?
78%
Enterprises with an active agent pilot
650-leader survey, Feb–Mar 2026
14%
Scaled an agent to org-wide production
The graduation rate
88%
Pilots that never reach production
Anaconda/Forrester, replicated by a16z + MIT Sloan
4.7 mo
Average pilot duration before stalling
Digital Applied
As of 2026, 78% of enterprises are running at least one active AI agent pilot, but only 14% have scaled a single agent to organization-wide production — the AI agent pilot to production rate 2026 is roughly one in seven. That figure comes from a Digital Applied survey of 650 technology leaders (VP of Technology or above, with deployment budget authority, at firms of 500 to 50,000-plus employees) fielded across February and March 2026.
The gap between 78% piloting and 14% producing is the single most important number in enterprise AI this year. It means the overwhelming majority of agent projects are stuck in a holding pattern that the Forrester analyst community has started calling perpetual piloting: running an endless parade of proofs-of-concept while shipping nothing at scale. The average pilot in the survey stalled after 4.7 months.
This is also where the headline 88% failure stat comes from. If 14% reach production, then roughly 86–88% do not — and the rounder 88% figure originated in Anaconda and Forrester research, then was replicated independently by a16z and an MIT Sloan CIO panel. IDC’s parallel finding is even more vivid: for every 33 AI proofs-of-concept a company launched, only four graduated to production. Different datasets, same brutal conversion rate.

The 14% production rate and the 88% failure rate come from different studies measuring slightly different things (org-wide scale vs. any production graduation). They tell the same story from two angles: a roughly seven-to-one ratio of pilots that stall to pilots that ship.
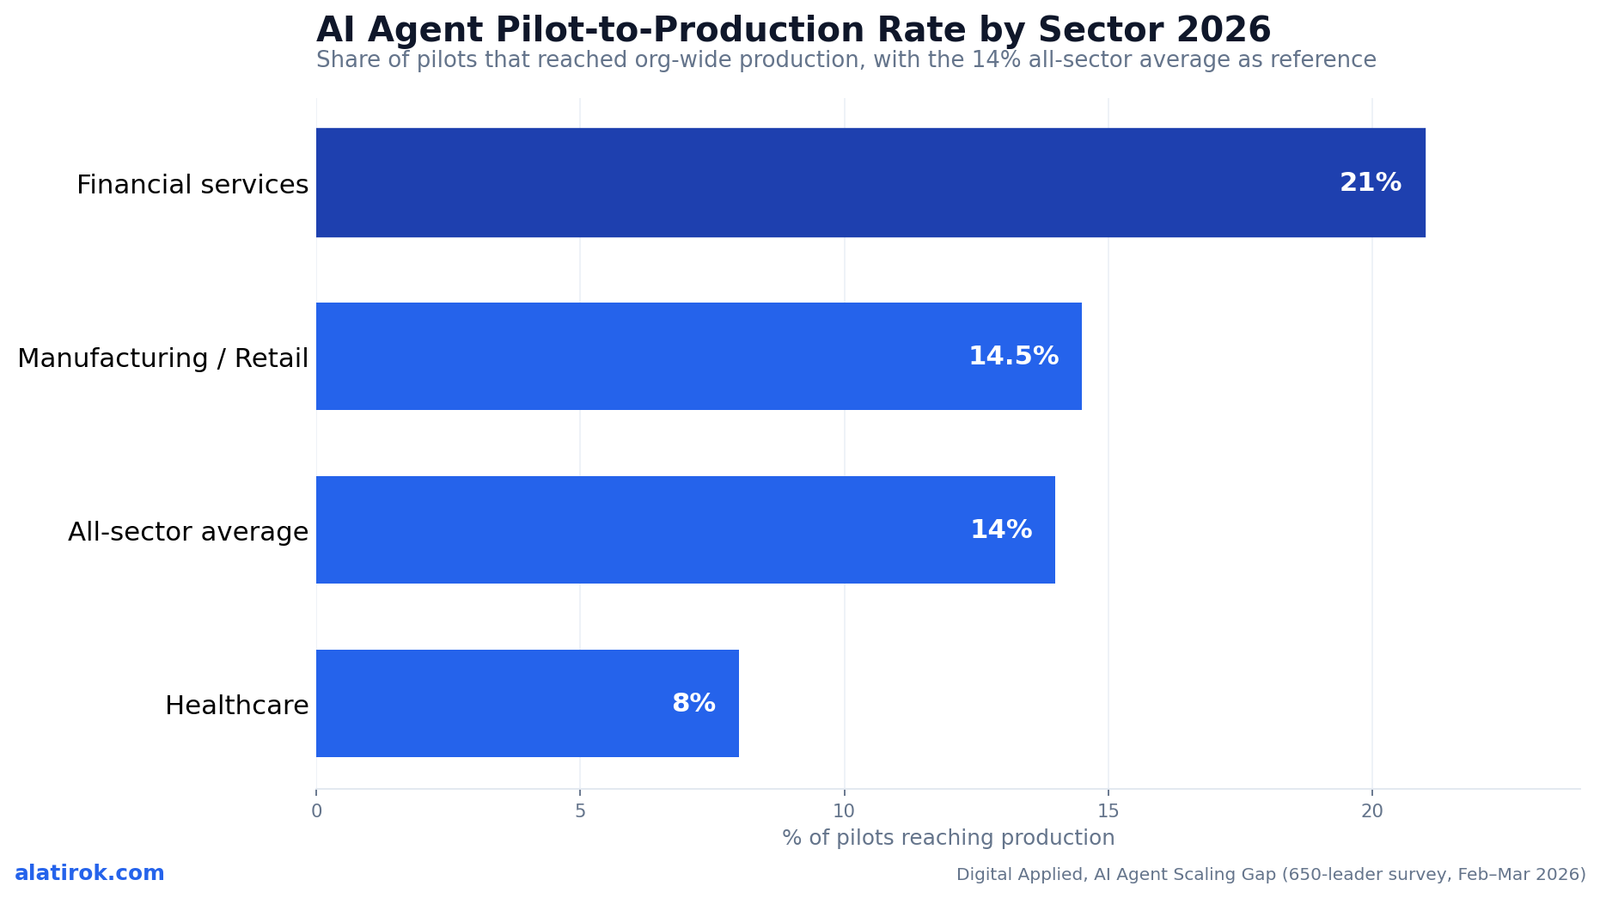
Pilot to production rate by sector: finance leads, healthcare trails
Financial services leads every sector at a 21% pilot-to-production rate, manufacturing and retail cluster near the 14% average at 13–16%, and healthcare trails at 8% — a 2.6x spread between the top and bottom sectors. The variance is not random; it tracks how reversible and auditable each sector’s early agent tasks are.
Financial services jumped ahead because its first agents targeted narrow, well-bounded jobs: document processing, KYC and compliance checks, reconciliation, and customer-service triage. These are tasks with clean inputs, a clear correct answer, and an existing audit culture — exactly the conditions under which an agent can be tested, monitored, and rolled back without ceremony. Manufacturing and retail sit at the average because their wins (forecasting, inventory, support deflection) are useful but messier to validate at volume.
Healthcare’s 8% is the data point people misread. It is not timidity — it is correct risk pricing. When a wrong output is a potential clinical or HIPAA event rather than a mispriced ad, the bar for ‘reliable enough to remove the human’ is legitimately higher, and regulatory review extends every timeline. The lesson for slower sectors is not to move faster; it’s to copy finance’s playbook of scoping the first agent to something narrow, auditable, and reversible.
A second Digital Applied dataset measures conversion slightly differently (12-month pilot-to-production by vertical) and shows the same ordering: banking and insurance at 58%, software 56%, telecom 53%, retail 48%, manufacturing 44%, energy 40%, professional services 38%, healthcare 33%, and government 29%. The absolute numbers are higher because the denominator is different, but finance-on-top and healthcare/government-on-bottom holds across both cuts.
| Sector | Org-wide production rate | 12-mo conversion (vertical cut) | Primary early use case |
|---|---|---|---|
| Financial services | 21% | 58% (banking/insurance) | KYC, reconciliation, compliance |
| Software | — | 56% | Code, support, internal ops |
| Telecom | — | 53% | Network ops, customer triage |
| Retail | 13–16% | 48% | Support deflection, merchandising |
| Manufacturing | 13–16% | 44% | Forecasting, inventory, QA |
| Healthcare | 8% | 33% | Documentation, prior-auth (gated) |
| Government | — | 29% | Citizen services (gated) |
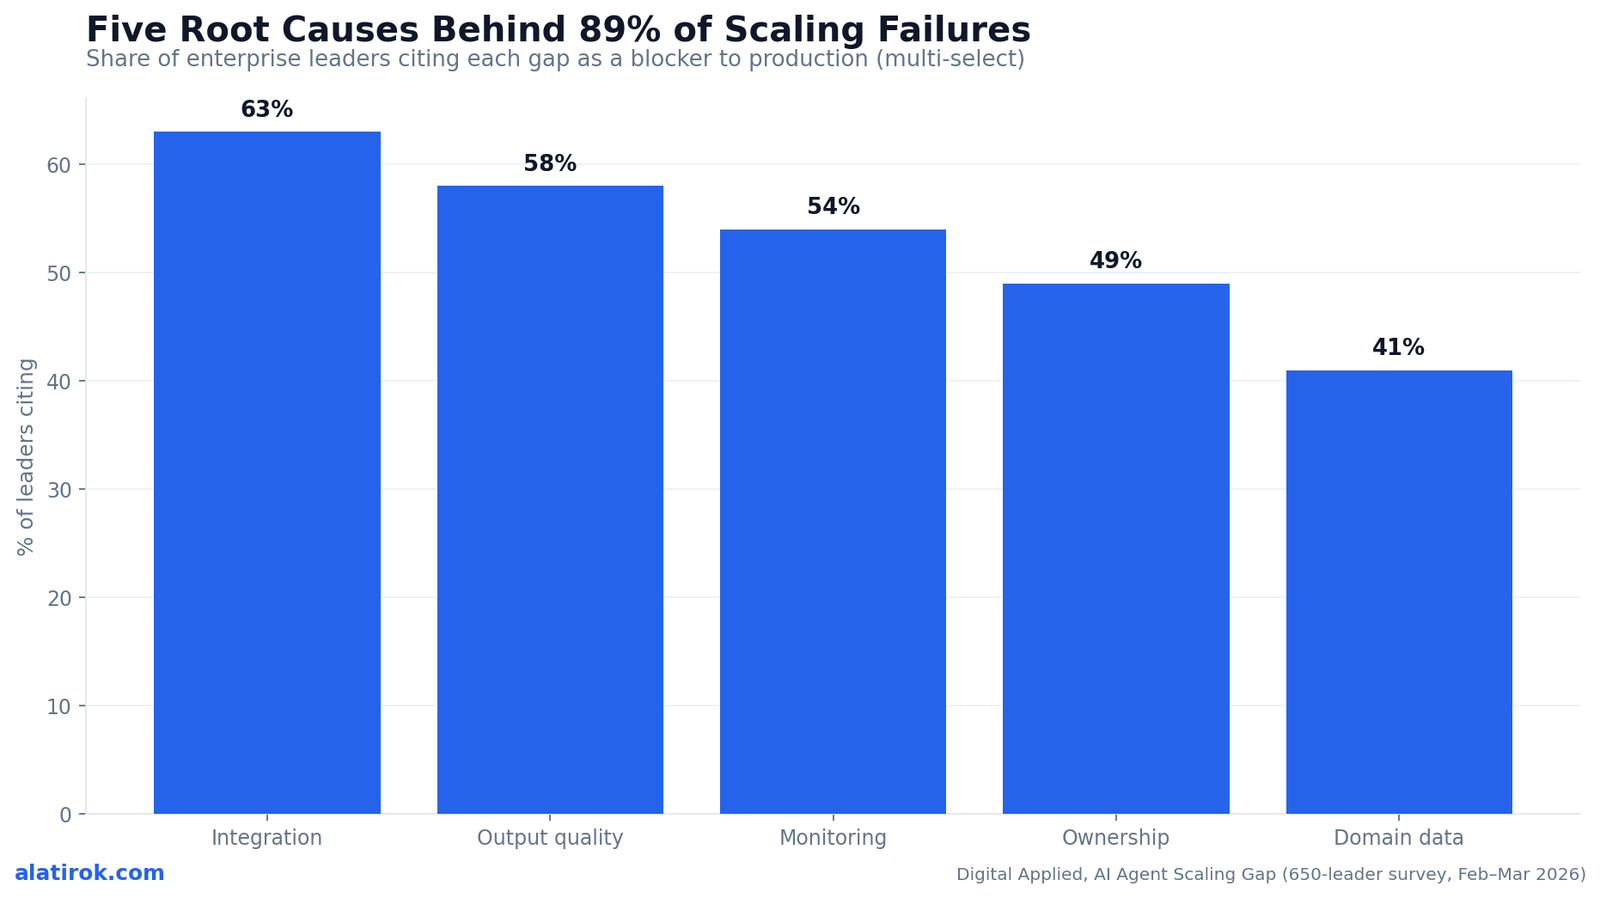
The 88% failure stat: five gaps explain 89% of it
Five recurring gaps account for 89% of agent scaling failures: integration complexity (cited by 63% of leaders), output quality at volume (58%), monitoring and observability deficits (54%), organizational ownership gaps (49%), and insufficient domain training data (41%). Note what is absent from that list — ‘the model isn’t capable enough’ appears nowhere near the top. The pilot-to-production gap is an operations and organization problem wearing an AI costume.
These causes are not independent; they compound. Ownership gaps leave monitoring gaps unfilled, which makes output-quality problems invisible until they’ve already propagated through a chain of tool calls and reached a customer. Integration complexity is the most-cited blocker because 86% of enterprises report needing tech-stack upgrades just to make agents compatible, and 42% of agents draw on eight or more data sources — every additional source is another seam where a silent failure can hide.
The monitoring deficit deserves special attention because it is the one that turns a recoverable problem into a catastrophic one. Nearly three in four organizations are giving agents access to their data and processes, yet only about 20% have a tested AI incident-response plan for when an agent misbehaves. A single user request now traces through an entire processing chain; without unified observability, the small errors accumulate until they surface as a major, customer-facing incident with no breadcrumb trail back to the root cause.
“The demo works because a human is standing next to it. Production fails because the human walks away and nothing was built to catch what happens next.”
On why the model is rarely the bottleneck
What a failed agent pilot actually costs
The average failed AI agent project burns about $340,000 in direct engineering expense, and 22% of agent deployments that do ship report negative ROI at the 12-month mark. Counting indirect costs — opportunity cost, delayed roadmaps, and the organizational chill that follows a public failure — Digital Applied puts the all-in figure north of $650,000 per failed project.
The cruelest detail in the cost data is timing: most of that $340,000 is spent in the final 30% of the project, after the failure patterns are already active but before anyone has admitted it. The team keeps grinding on integration glue and prompt tweaks while the fundamental gap — no evals, no owner, no monitoring — goes unaddressed. The money doesn’t buy a fix; it buys a slower, more expensive death.
The 22% negative-ROI figure is the one that should worry CFOs more than the raw failure rate, because these are the agents that reached production and still lost money. Per the survey, those losses are ‘almost always tied to scope creep, missing evals, or absent ownership rather than model capability’ — the same operational gaps that kill pilots also quietly bleed the survivors. And the damage outlasts the project: a failed agent initiative tends to make leadership risk-averse toward AI for 12 to 24 months, delaying the very investments that would have fixed the underlying readiness problem.
Beyond the $340K direct and $650K+ all-in cost, the most expensive line item is the 12–24 months of leadership risk-aversion that follows a visible flop. One badly-scoped pilot can freeze an entire org’s agent roadmap.
What the 12% that reach production do differently
Organizations that reach production are 2.7x more likely to have named a single agent owner before scaling, and deployments that skip evaluation infrastructure take 3x longer to reach stable production while rolling back at 47% versus 9% for those with full eval coverage. The winners are not using better models; they are using better operating discipline, and the survey data quantifies exactly how much that discipline is worth.
Ownership is the highest-leverage move. Teams without a dedicated AI-operations function were 5.7x more likely to roll an agent back after launch, and a named owner — one person with a pager, not a committee — correlates with a 2.7x higher production-conversion rate. ‘The AI team owns it’ is functionally identical to ‘nobody owns it’ at 2am when the agent starts producing garbage and there’s no one whose job it is to notice.
Evaluation infrastructure is the second pillar, and the gap here is stark: only 38% of production agents currently have automated evaluations running on every prompt change. The agents that do enjoy a 9% rollback rate; those without evals roll back at 47% — more than five times as often. Build the eval harness before the agent does anything genuinely useful. It feels like over-engineering on day one and it is the entire difference between the 12% and everyone else by day 90.
The third pattern is psychological: the graduating 12% scope their first agent narrower than feels comfortable, invest in data readiness before agent development, build security and governance concurrently rather than bolting them on, and — crucially — treat a rollback as telemetry rather than a verdict. The orgs that read one failed deploy as proof that ‘AI doesn’t work’ are the ones that pilot forever and produce nothing.
Pros
Cons
How to read these numbers if you own an agent roadmap
The 88% is an ops problem, not an AI problem
If you are deciding where to place agent bets in 2026, the data says: pick a sector-appropriate narrow task, fund ownership and evals before headcount on the agent itself, and budget for the 88% as a portfolio reality rather than an aspiration to beat with hope alone. The graduation rate is improvable, but only through the specific operational moves the survivors made — not through a better demo.
Use the sector benchmarks as a planning anchor, not a destiny. If you’re in healthcare or government and your pilots are stalling, an 8–33% production range is the baseline you’re working against; scoping a reversible, well-audited first task is how finance got to 21%, and the same playbook ports. If you’re in financial services and below 21%, the gap is almost certainly one of the five operational causes, not your industry.
Finally, treat the $340K failed-project figure as a cheap insurance quote. Digital Applied estimates that roughly $50,000 of upfront investment in scoping, evals, and ownership prevents about $424,500 in expected downstream failure costs. That is the entire thesis of the pilot-to-production gap in one ratio: the work that closes the gap is an order of magnitude cheaper than the failure it prevents, and almost nobody does it before they’ve already paid for the lesson.
The pilot-to-production gap is not a capability ceiling — it is an operating-discipline gap. Owners, evals, and narrow scope, in that order, are what move an org from the 88% into the 12%.Builder’s take
I’m Surya Koritala, and I build agent systems for a living — Cyntr (a content-orchestration engine that runs autonomous agents in production) and Loomfeed (a discussion platform). The 88% number is not a mystery to anyone who has actually shipped one of these. The demo works because a human is standing next to it. Production fails because the human walks away and nothing was built to catch what happens next. Here is what the data confirms and what I’d tell any team staring down a stalled pilot:
- The graduation gap is an operations gap, not a model gap. None of the top five root causes — integration, output quality at volume, monitoring, ownership, domain data — is ‘the model isn’t smart enough.’ I have never once been blocked by raw capability. I’ve been blocked by not knowing an agent silently degraded three days ago.
- Build the eval harness before the agent does anything useful. The data says no-eval deployments roll back at 47% versus 9% with full coverage. In Cyntr, every prompt change runs against a fixed battery before it touches the live feed. It feels slow on day one and saves you the $340K post-mortem on day 90.
- Name an owner with a pager, not a committee. The 2.7x conversion lift for a named agent owner matches my experience exactly. ‘The AI team’ owning an agent means nobody owns it at 2am when it starts hallucinating currency symbols into every post — a bug I have personally chased.
- Healthcare’s 8% is rational, not a failure of nerve. When a wrong output is a clinical or compliance event, the bar for ‘reliable at volume’ is correctly higher. Don’t shame the slow sectors; copy how finance scoped narrow, auditable, reversible tasks first.
- Scope smaller than feels comfortable, then ship and roll back without drama. The 12% that graduate treat a rollback as telemetry, not a verdict. If your org reads one failed deploy as proof ‘AI doesn’t work,’ you will perpetually pilot and never produce.
Frequently asked questions
About 14%. In a Digital Applied survey of 650 technology leaders (Feb–Mar 2026), 78% of enterprises had an active AI agent pilot but only 14% had scaled an agent to organization-wide production. The roughly 86–88% that don’t graduate are the source of the widely-cited 88% failure stat.
It originated in research from Anaconda and Forrester and was independently replicated by a16z and an MIT Sloan CIO panel. IDC reported a parallel finding: for every 33 AI proofs-of-concept launched, only four graduated to production — the same roughly seven-to-one stall ratio.
Financial services, at 21% — the highest of any sector in 2026. It led because its first agents targeted narrow, auditable, reversible tasks like KYC, reconciliation, and compliance. Healthcare trails at 8% due to clinical and regulatory risk, with manufacturing and retail near the 14% average at 13–16%.
Five gaps account for 89% of failures: integration complexity (cited by 63% of leaders), output quality at volume (58%), monitoring and observability deficits (54%), organizational ownership gaps (49%), and insufficient domain training data (41%). Raw model capability is not among the top causes.
About $340,000 in direct engineering expense on average, and more than $650,000 all-in once indirect costs are counted. Separately, 22% of agents that do reach production report negative ROI at 12 months, usually due to scope creep, missing evals, or absent ownership.
They name a single accountable agent owner before scaling (2.7x higher conversion), build automated evaluation infrastructure first (9% rollback rate vs 47% without evals), scope the first agent narrowly and reversibly, and treat a rollback as telemetry rather than proof that AI doesn’t work. Teams without dedicated AI-ops are 5.7x more likely to roll back.
Primary sources
- AI Agent Scaling Gap, March 2026: Pilot to Production (650-leader survey) — Digital Applied
- Why 88% of AI Agents Never Reach Production: Failure Framework — Digital Applied
- AI Agent Adoption 2026: 120+ Enterprise Data Points — Digital Applied
- 88% of AI pilots fail to reach production — but that’s not all on IT — CIO / IDC
Last updated: June 1, 2026. Related: Observability.