A complete, vendor-neutral build: a free LGTM docker-compose backend, OTel auto-instrumentation that renders a full agent reasoning trace, and Collector-side PII redaction for prompts.
What does it take to self-host LLM observability with OpenTelemetry?
To self-host LLM observability with OpenTelemetry you need three things: an OTel-based instrumentation SDK that emits GenAI-convention spans (OpenLLMetry or OpenLIT), an OpenTelemetry Collector that redacts sensitive prompt content, and a free self-hosted backend like the Grafana LGTM stack (Loki, Mimir, Tempo, Grafana) to store and visualize traces. No managed vendor, no per-trace meter, no per-seat fee — you run the whole pipeline on a box you control.
Most tutorials on this topic quietly cheat. They either funnel you to a managed backend (Grafana Cloud, Datadog, Uptrace Cloud) after showing you the open-source SDK, or they stop at auto-instrumentation and never show the agent-specific span tree, the GenAI-conventions PII problem, or how to choose between the two main SDKs. This guide ships the complete build: a docker-compose-style LGTM backend, an instrumented agent whose every tool call and LLM call becomes a child span, and a Collector config that drops prompts and completions before they ever touch disk.
The timing is good. OpenTelemetry’s GenAI semantic conventions — the standardized span names, attribute keys, and metrics that make traces portable across tools — reached stable for the core LLM-call and token-usage layer in early 2026, while many agent-orchestration attributes remain experimental (per the OpenTelemetry GenAI spec and the OpenTelemetry blog). That means the foundations you instrument today will not be renamed out from under you, which is exactly when self-hosting becomes a sound long-term bet rather than a maintenance treadmill.
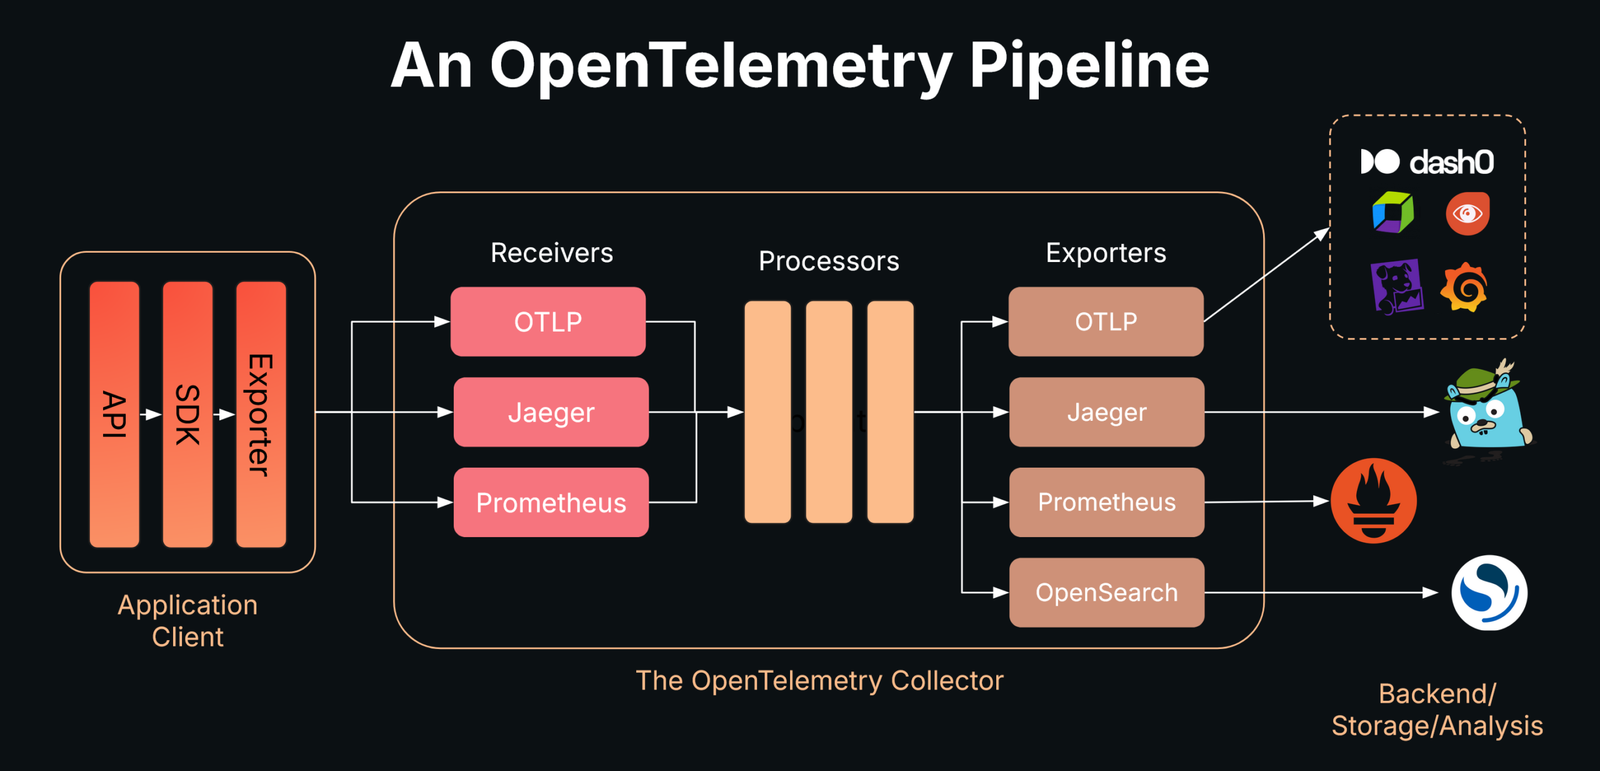
Here is the architecture you will build, end to end:
Engineers running LangChain, LlamaIndex, CrewAI, AutoGen, or raw OpenAI/Anthropic agents who want a vendor-neutral tracing stack on their own infrastructure — and a hard exit from LangSmith or Datadog pricing. You should be comfortable with Docker and Python.
Your agent (Python)
  └─ OpenLLMetry / OpenLIT SDK   # emits GenAI-convention OTLP spans
          │  OTLP gRPC :4317 / HTTP :4318
          ▼
OpenTelemetry Collector          # redacts prompts/PII, samples, routes
          │  OTLP
          ▼
Grafana LGTM stack (self-hosted)
  ├─ Tempo   (traces)             # the agent reasoning waterfall
  ├─ Mimir   (metrics)            # token usage, latency histograms
  ├─ Loki    (logs)
  └─ Grafana (:3000 dashboards)   # admin / admin
Why self-host instead of paying for LangSmith or Datadog?
Self-hosting wins when your observability bill scales with traces or seats faster than your revenue does — which is exactly what happens with agents, because a single agent request emits dozens of spans. Managed LLM observability prices the thing agents produce most: traces. The Grafana LGTM stack is open source and free to run, so your only cost is the compute and storage you already operate.
The numbers make the case. LangSmith‘s Plus plan is $39/month per seat and includes 10,000 base traces, then charges $2.50 per additional 1,000 traces; a seat is every user in the org (LangChain pricing). Langfuse is friendlier — a genuinely usable free tier and unlimited users on paid plans, and its core features are MIT-licensed and fully self-hostable (Langfuse self-hosting docs) — but self-hosting Langfuse still pulls in PostgreSQL, ClickHouse, Redis, and S3-compatible storage to operate.
An agent is a trace amplifier. Where a classic web request is one span, an agent request fans out into an invoke_agent parent with a chat span per LLM turn, an execute_tool span per tool call, and a retrieval span per vector lookup. A multi-step reasoning chain can be 20-40 spans. On a per-trace meter, the cost of observing the workloads you most need to debug climbs fastest — which is the opposite of what you want.
The honest trade-off: self-hosted is not free, it is fixed-cost. You swap a usage meter for an operational responsibility — storage retention, upgrades, backups. For high-volume agent fleets that flips in your favor quickly; for a single hobby agent, a managed free tier is simpler. The table below frames the decision.
“An agent is a trace amplifier — one request becomes 20 to 40 spans. On a per-trace meter, observing the workloads you most need to debug costs the most.”
The self-hosting case in one line
| Dimension | Self-hosted LGTM + OTel | LangSmith (managed) | Langfuse (managed) |
|---|---|---|---|
| Software license cost | $0 (open source) | $39/seat/mo (Plus) | Free tier; Core $29/mo |
| Per-trace overage | None | $2.50 / 1,000 traces | ~$8 / 100,000 units |
| Seats | Unlimited | Billed per user | Unlimited on paid |
| Data residency | Your infra, fully | Vendor cloud | Vendor cloud or self-host |
| You operate | Collector + LGTM + storage | Nothing | Nothing (or full self-host) |
| Vendor lock-in | None (OTLP/OTel) | SDK-coupled | Low (OTLP ingest) |
What are OpenTelemetry GenAI semantic conventions for agents?
OpenTelemetry GenAI semantic conventions are the standardized span names, attribute keys, metric names, and event shapes that describe LLM and agent operations — so a trace emitted by one SDK renders identically in any OTel backend. They are what make self-hosting portable: instrument once against the convention and you are never locked to a vendor’s bespoke schema.
For agents, the spec defines operation names you compose into span names. The OpenTelemetry GenAI spans spec lists well-known gen_ai.operation.name values including chat, embeddings, execute_tool, create_agent, invoke_agent, and retrieval. Span names follow patterns like chat {gen_ai.request.model}, execute_tool {gen_ai.tool.name}, and retrieval {gen_ai.data_source.id}. That naming is what produces a readable waterfall instead of a wall of anonymous spans.
The attribute keys you will rely on most (from the GenAI spans spec): gen_ai.provider.name (required), gen_ai.request.model and gen_ai.response.model, the token-usage trio gen_ai.usage.input_tokens / gen_ai.usage.output_tokens / gen_ai.usage.reasoning.output_tokens, gen_ai.conversation.id, and for tools gen_ai.tool.name and gen_ai.tool.call.id. Metrics include gen_ai.client.operation.duration (latency histogram) and gen_ai.client.token.usage (consumption histogram, split by gen_ai.token.type), per the OpenTelemetry blog.
Stability status matters for self-hosting because it tells you what is safe to build dashboards on. As of 2026 the core LLM client-call and token attributes are stable; agent and tool attributes are still in development. Existing instrumentation should not silently change which convention version it emits — you opt into newer experimental conventions explicitly with OTEL_SEMCONV_STABILITY_OPT_IN (OpenTelemetry GenAI spec). Pin it deliberately.
Prompt and completion content is captured either as opt-in span attributes (gen_ai.input.messages, gen_ai.output.messages) or, preferably, as a dedicated event (gen_ai.client.inference.operation.details), and is OFF by default. This is the seam you exploit for PII control later — content can be dropped at the Collector without touching app code.
| Span / operation | Span kind | Key attributes | Stability (2026) |
|---|---|---|---|
| invoke_agent {name} | INTERNAL | gen_ai.agent.name, gen_ai.conversation.id | Experimental |
| chat {model} | CLIENT | gen_ai.request.model, gen_ai.usage.input_tokens, gen_ai.usage.output_tokens, gen_ai.response.finish_reasons | Core stable |
| execute_tool {tool} | INTERNAL | gen_ai.tool.name, gen_ai.tool.call.id, gen_ai.tool.call.arguments | Experimental |
| retrieval {source} | INTERNAL | gen_ai.data_source.id | Experimental |
| embeddings {model} | CLIENT | gen_ai.request.model, gen_ai.usage.input_tokens | Core stable |
Step 1: Stand up a free self-hosted LGTM backend with docker-compose
The fastest genuinely self-hosted LLM observability backend is the Grafana LGTM stack, available as the single grafana/otel-lgtm container that bundles an OpenTelemetry Collector, Tempo (traces), Mimir/Prometheus (metrics), Loki (logs), and Grafana — exposing OTLP on 4317/4318 and Grafana on 3000. It is purpose-built for self-managed development and demo backends (grafana/docker-otel-lgtm), and it runs anywhere Docker does, at zero software cost.
Create a docker-compose.yml. We run the all-in-one LGTM image and a standalone OpenTelemetry Collector in front of it, because the standalone Collector is where we will do PII redaction in Step 3. Your agent talks to the Collector; the Collector forwards clean telemetry to LGTM.
Run docker compose up -d, then open http://localhost:3000 (admin / admin). Tempo, Mimir, and Loki are pre-wired as Grafana data sources. You now have a complete LLM observability backend running locally for $0 in software.
# docker-compose.yml — self-hosted LLM observability stack
services:
  # Standalone Collector: redaction + routing live here
  otel-collector:
    image: otel/opentelemetry-collector-contrib:0.128.0
    command: ["--config=/etc/otelcol/config.yaml"]
    volumes:
      - ./collector.yaml:/etc/otelcol/config.yaml
    ports:
      - "4317:4317"   # OTLP gRPC (your agent sends here)
      - "4318:4318"   # OTLP HTTP
    depends_on:
      - lgtm

  # Grafana LGTM all-in-one: Tempo + Mimir + Loki + Grafana
  lgtm:
    image: grafana/otel-lgtm:0.11.0
    ports:
      - "3000:3000"   # Grafana UI  (login: admin / admin)
    environment:
      # keep traces around long enough to debug real incidents
      - PROMETHEUS_EXTRA_ARGS=--storage.tsdb.retention.time=30d
    volumes:
      - lgtm-data:/data

volumes:
  lgtm-data:
docker compose up exits immediately or Grafana shows no data sources
The grafana/otel-lgtm image takes 20-40s to initialize all four backends on first boot. Run `docker compose logs -f lgtm` and wait for the line indicating Grafana is ready before opening :3000. If traces never appear, confirm your agent is sending to the Collector on 4317 (not directly to LGTM), and that the Collector’s internal exporter points at the lgtm service hostname, not localhost — inside Compose, localhost is the Collector container itself.Port 4317 already in use
Another Collector, a local agent, or a previous run is bound to OTLP gRPC. Find it with `lsof -i :4317` (or `docker ps`) and stop it, or remap the host side in compose to e.g. `4327:4317` and set OTEL_EXPORTER_OTLP_ENDPOINT accordingly in your app.Step 2: Instrument your agent — OpenLLMetry vs OpenLIT
The two main OTel-native, GenAI-convention-aligned auto-instrumentation SDKs are OpenLLMetry (Traceloop) and OpenLIT — both turn each LLM call, tool call, and retrieval into a child span with one import. Pick OpenLLMetry for the widest framework catalog and richest signals; pick OpenLIT for the simplest multi-provider, OTLP-native setup. Either one renders a full agent reasoning trace in your LGTM Tempo view.
Both auto-instrument the providers and frameworks you actually use. OpenLLMetry covers OpenAI/Azure OpenAI, Anthropic, Cohere, Mistral, plus LangChain, LlamaIndex, CrewAI, LangGraph, and Haystack, and instruments your vector DB and ordinary HTTP/DB calls too (Traceloop OpenLLMetry repo). OpenLIT ships Python and TypeScript SDKs and instruments OpenAI, Anthropic, LangChain, LlamaIndex, and vector DBs including Pinecone, Qdrant, Chroma, and Milvus (OpenLIT).
Here is the full OpenLLMetry init, pointed at the Collector you started in Step 1. Critically, we leave content capture OFF — prompts and completions stay out of the trace until you decide otherwise, which is the safe production default. The OpenLIT equivalent is in the troubleshooting block below; note the one-call init and the explicit capture_message_content flag. Use whichever SDK matches your stack, because the spans they emit are convention-compatible — your Collector config and Grafana dashboards do not change when you switch.
Pros
Cons
# --- Option A: OpenLLMetry (Traceloop SDK) ---
# pip install traceloop-sdk openai
import os
from traceloop.sdk import Traceloop
from openai import OpenAI

# Send OTLP to the local Collector (NOT a managed cloud endpoint)
os.environ["OTEL_EXPORTER_OTLP_ENDPOINT"] = "http://localhost:4318"
# Production-safe default: do NOT record prompt/completion bodies.
# Redaction also happens at the Collector (defense in depth).
os.environ["TRACELOOP_TRACE_CONTENT"] = "false"

Traceloop.init(app_name="support-agent", disable_batch=True)

client = OpenAI()

def get_weather(city: str) -> str:
    return f"{city}: 21C, clear"   # a tool the agent can call

def run_agent(user_msg: str) -> str:
    tools = [{
        "type": "function",
        "function": {
            "name": "get_weather",
            "description": "Current weather for a city",
            "parameters": {"type": "object",
                "properties": {"city": {"type": "string"}},
                "required": ["city"]},
        },
    }]
    # First LLM turn -> emits a `chat` span with token usage
    resp = client.chat.completions.create(
        model="gpt-4o-mini",
        messages=[{"role": "user", "content": user_msg}],
        tools=tools,
    )
    call = resp.choices[0].message.tool_calls[0]
    # Tool execution -> wrap so it shows as an `execute_tool` child span
    result = get_weather(eval(call.function.arguments)["city"])
    # Second LLM turn with the tool result -> another `chat` span
    final = client.chat.completions.create(
        model="gpt-4o-mini",
        messages=[
            {"role": "user", "content": user_msg},
            resp.choices[0].message,
            {"role": "tool", "tool_call_id": call.id, "content": result},
        ],
    )
    return final.choices[0].message.content

print(run_agent("What's the weather in Lisbon?"))
Show the OpenLIT version of the same setup
OpenLIT is even terser. Install with `pip install openlit`, then call openlit.init(otlp_endpoint=”http://localhost:4318″, capture_message_content=False, application_name=”support-agent”). Everything after that — your OpenAI/Anthropic/LangChain calls — is auto-instrumented. The emitted spans follow the same GenAI conventions, so the Collector redaction in Step 3 and your Grafana dashboards work identically. This is the payoff of standardization: the SDK is a swappable component, not a lock-in.Step 3: Redact prompts and PII at the OpenTelemetry Collector
The right place to strip PII from LLM traces is the OpenTelemetry Collector, not the app — because prompt and completion content lives in span attributes and events that the Collector can drop or mask centrally, so the rule survives SDK and framework changes. This is the single most-skipped step in other tutorials, and it is non-negotiable: prompts routinely contain names, emails, financial and medical data.
Use a three-layer defense (per the maketocreate PII guide and the OpenTelemetry Collector filter processor docs): (1) keep content capture off at the SDK by default, which you already did in Step 2; (2) drop the dedicated content events and message attributes with the filter and redaction processors; (3) for any content you do keep in staging, mask residual PII with the transform processor’s OTTL regexes. Here is a Collector config (collector.yaml) that does all three.
The filter processor’s spanevent context drops the content-bearing event outright; if all events for a span are dropped, the span itself stays intact, so you keep the full timing waterfall and token counts while losing the sensitive payload. The redaction processor flips to an allowlist — anything not explicitly permitted is deleted, the safest posture for prompt attributes. The transform processor is your belt-and-suspenders regex pass for staging pipelines where you deliberately retain some content.
If you redact in application code, every service must reimplement it and a single framework upgrade can leak content again. A Collector-side rule is enforced once for every agent that ships telemetry through it — and it is the only layer the SDK author cannot accidentally bypass.
# collector.yaml — redact LLM prompts/PII before anything is stored
receivers:
  otlp:
    protocols:
      grpc: { endpoint: 0.0.0.0:4317 }
      http: { endpoint: 0.0.0.0:4318 }

processors:
  # (2a) Drop the content-bearing GenAI events entirely.
  filter/drop-content:
    error_mode: ignore
    traces:
      spanevent:
        - 'name == "gen_ai.client.inference.operation.details"'
        - 'IsMatch(name, "gen_ai.content.*")'

  # (2b) Allowlist: keep only known-safe GenAI attributes, delete the rest.
  redaction/genai:
    allow_all_keys: false
    allowed_keys:
      - gen_ai.provider.name
      - gen_ai.operation.name
      - gen_ai.request.model
      - gen_ai.response.model
      - gen_ai.usage.input_tokens
      - gen_ai.usage.output_tokens
      - gen_ai.token.type
      - gen_ai.agent.name
      - gen_ai.tool.name
      - gen_ai.conversation.id
    blocked_key_patterns:
      - '.*\.messages'              # gen_ai.input.messages / output.messages
      - '.*\.system_instructions'

  # (3) Staging-only: mask residual PII in any retained content.
  transform/scrub:
    error_mode: ignore
    trace_statements:
      - context: span
        statements:
          - replace_pattern(attributes["gen_ai.input.messages"],
              "[A-Za-z0-9._%+-]+@[A-Za-z0-9.-]+\\.[A-Za-z]{2,}", "<EMAIL>")
          - replace_pattern(attributes["gen_ai.output.messages"],
              "\\b\\d{3}-\\d{2}-\\d{4}\\b", "<SSN>")

  batch: {}

exporters:
  # Forward CLEAN telemetry to the self-hosted LGTM stack.
  otlp/lgtm:
    endpoint: lgtm:4317
    tls: { insecure: true }

service:
  pipelines:
    traces:
      receivers: [otlp]
      processors: [filter/drop-content, redaction/genai, transform/scrub, batch]
exporters: [otlp/lgtm]Step 4: Read the agent reasoning trace in Grafana Tempo
In Grafana, open Explore, select the Tempo data source, and run the agent request — the trace renders as a waterfall with invoke_agent as the parent and chat, execute_tool, and retrieval spans nested beneath, each showing duration and token usage. This is the full reasoning chain in one view, and it is what auto-instrumentation tutorials almost never actually show you.
A healthy two-turn tool-using agent looks like the tree below — one LLM turn to decide on a tool, the tool call itself, then a second LLM turn to compose the answer. Read it as latency (the widest bars are where time goes) and as logic (a tool span that repeats five times is an agent stuck in a loop).
Two correlations make Tempo on LGTM genuinely powerful for agents. First, click any chat span and its gen_ai.usage.input_tokens / output_tokens attributes tell you the cost of that exact turn — and because those metrics also flow to Mimir, you can build a token-spend-per-conversation dashboard. Second, trace-to-logs links jump from a failing span straight to the Loki log line, so a tool exception is one click from its stack trace. None of this required a managed vendor.
Tempo trace: "What's the weather in Lisbon?"

invoke_agent support-agent ............. 1,180 ms  [INTERNAL]
├─ chat gpt-4o-mini ....................   620 ms  [CLIENT]
│     gen_ai.usage.input_tokens   = 86
│     gen_ai.usage.output_tokens  = 24
│     gen_ai.response.finish_reasons = [tool_calls]
├─ execute_tool get_weather ...........     9 ms  [INTERNAL]
│     gen_ai.tool.name      = get_weather
│     gen_ai.tool.call.id   = call_a1b2
└─ chat gpt-4o-mini ....................   540 ms  [CLIENT]
      gen_ai.usage.input_tokens   = 132
      gen_ai.usage.output_tokens  = 38
      gen_ai.response.finish_reasons = [stop]

# Note: NO prompt/completion text in any span — redacted at the Collector.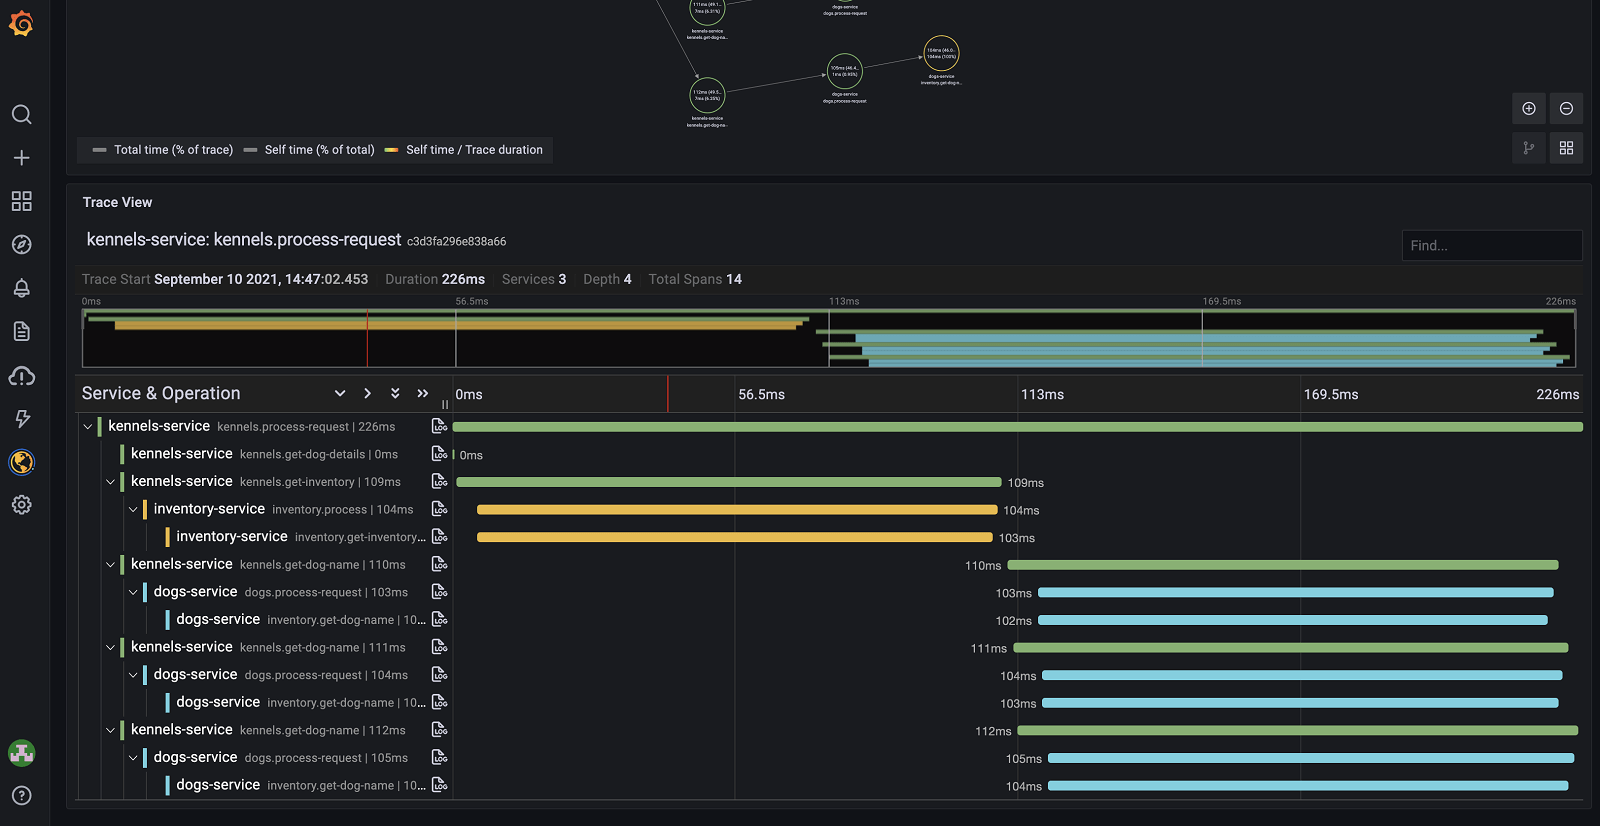
My spans show up flat (no parent-child nesting)
Flat traces almost always mean context is not propagating. Inside one Python process, OpenLLMetry/OpenLIT handle this automatically. Across processes or async tasks, ensure the active span context is carried (use the SDK’s session/workflow decorators, or propagate via OTel context). Also confirm you are NOT setting a fresh tracer/exporter per request, which fragments the trace into singletons.Token usage attributes are missing on chat spans
Token counts come from the provider response. If you call a streaming endpoint without consuming usage, or use a provider/model the instrumentor does not yet map, gen_ai.usage.* can be absent. Confirm your instrumentor version supports the provider, and avoid stripping usage attributes too aggressively in the redaction allowlist — they must be in allowed_keys.Is a self-hosted OpenTelemetry stack a real alternative to LangSmith and Langfuse?
Self-host it when trace volume or data residency drives the decision
Yes — a self-hosted OpenTelemetry + LGTM stack is a complete, vendor-neutral alternative to LangSmith and Langfuse for tracing, token accounting, and PII-safe content handling, with the trade-off that you operate the infrastructure instead of paying a usage meter. What you give up is the turnkey evaluation and prompt-management UX that the managed products layer on top; what you gain is full data residency, no per-seat or per-trace cost, and zero lock-in.
Be clear-eyed about the gap. LangSmith and Langfuse bundle dataset-based evals, prompt versioning, annotation queues, and human review out of the box. The LGTM stack is observability infrastructure, not an eval platform — pair it with an evaluation harness if you need scored runs. But for the core job of seeing what your agent did, how many tokens it burned, and where it broke, the self-hosted stack is fully sufficient and, for agent-scale trace volume, dramatically cheaper.
The strategic reason to build on OTel is portability. Because everything speaks the GenAI conventions over OTLP, you can run LGTM today, point the same Collector at a managed backend tomorrow for a specific team, or fan out to both — without re-instrumenting a single agent. That optionality is the real product of self-hosting: you own your telemetry pipeline, and the backend becomes a swappable decision rather than a five-year commitment.
If you want to go deeper, this build pairs naturally with our LLM Observability Stack 2026 overview, the LangSmith vs Langfuse comparison for when managed makes sense, LLM-as-a-Judge for adding evals on top of these traces, and Top 7 Agent Evaluation Tools.
Builder’s take
I run observability for Cyntr’s agent orchestration and Loomfeed’s feed pipeline, and I moved both off managed tracing for the same reason most teams eventually do: the per-trace and per-seat meters punish exactly the workloads you most want to inspect. Here is what actually matters once you self-host.
- The Collector is the load-bearing wall, not the SDK. Put redaction, sampling, and routing there once and every agent service inherits it for free — swap OpenLLMetry for OpenLIT next quarter and your PII rules never move.
- Capture message content OFF by default in prod, ON in a separate staging pipeline. The single most expensive mistake is shipping full prompts to a long-retention backend because someone left content capture on for a demo.
- The span tree IS the eval surface. Once invoke_agent → chat → execute_tool renders as a waterfall, you can see the loop where the agent retries a tool five times — and that is usually a bigger latency win than any model swap.
- Self-hosted is not free, it is fixed-cost. You trade a usage meter for a box you operate. For agent workloads that emit dozens of spans per request, the math flips in your favor fast — but budget the ClickHouse/Tempo storage, not zero.
- Pin your GenAI semconv version. Core call/token attributes went stable in early 2026; agent attributes are still moving. Use OTEL_SEMCONV_STABILITY_OPT_IN deliberately so a library upgrade does not silently rename your fields.
Frequently asked questions
Yes. Loki, Mimir, Tempo, and Grafana are open source, and the grafana/otel-lgtm container bundles them with an OpenTelemetry Collector at no software cost. Your only spend is the compute and storage to run it. Unlike managed LLM observability, there is no per-trace or per-seat meter, which is why self-hosting wins for high-span-count agent workloads.
Install an OTel-native GenAI SDK — OpenLLMetry (pip install traceloop-sdk) or OpenLIT (pip install openlit) — set OTEL_EXPORTER_OTLP_ENDPOINT to your Collector, and call the init function once. Auto-instrumentation then turns each LLM call into a chat span, each tool call into an execute_tool span, and each vector lookup into a retrieval span, nested under an invoke_agent parent — the full reasoning chain as a trace waterfall.
Content is captured either as opt-in span attributes (gen_ai.input.messages, gen_ai.output.messages) or as a dedicated event (gen_ai.client.inference.operation.details), and is off by default. Redact at the OpenTelemetry Collector: use the filter processor’s spanevent context to drop content events, the redaction processor in allowlist mode to keep only safe attributes, and the transform processor’s OTTL replace_pattern to mask residual PII. Doing it at the Collector means the rule survives SDK and framework changes.
Use OpenLLMetry (Traceloop) for the widest framework catalog (LangChain, LlamaIndex, CrewAI, LangGraph, Haystack) and richest signals, plus session decorators. Use OpenLIT for the simplest one-call, OTLP-native, multi-provider setup with Python and TypeScript SDKs. Both align with the GenAI semantic conventions, so they emit compatible spans — you can swap one for the other without changing your Collector config or Grafana dashboards.
Partly. The core LLM client-call and token-usage attributes (gen_ai.request.model, gen_ai.usage.input_tokens, gen_ai.usage.output_tokens, and the related metrics) reached stable in early 2026, while many agent and tool attributes (invoke_agent, execute_tool, gen_ai.tool.*) remain experimental. Pin your convention version with OTEL_SEMCONV_STABILITY_OPT_IN so a library upgrade does not silently rename fields your dashboards depend on.
For tracing, token accounting, latency analysis, and PII-safe content handling, yes — a self-hosted OTel + LGTM stack does all of it with no usage meter and full data residency. What it does not include out of the box is the dataset-based evaluation, prompt versioning, and annotation UX that the managed products bundle. If you need those, pair the stack with an eval harness, or use OTLP’s portability to run both a self-hosted backend and a managed one from the same instrumentation.
Primary sources
- Inside the LLM Call: GenAI Observability with OpenTelemetry — OpenTelemetry
- Semantic conventions for generative AI spans — OpenTelemetry
- How OpenTelemetry Traces LLM Calls, Agent Reasoning, and MCP Tools — Greptime
- OpenTelemetry for AI Systems: LLM and Agent Observability (2026) — Uptrace
- docker-otel-lgtm: An OpenTelemetry backend in a Docker container — Grafana Labs
- OpenLLMetry: Open-source observability for GenAI, based on OpenTelemetry — Traceloop
- OpenLIT: OpenTelemetry-native GenAI and LLM Application Observability — OpenLIT
- Filter Processor README — OpenTelemetry Collector Contrib
- OpenTelemetry GenAI: Tracing AI Agents Without Leaking PII — maketocreate.com
- LangSmith Plans and Pricing — LangChain
- Self-Hosting Langfuse (Open Source LLM Observability) — Langfuse
Last updated: June 2, 2026. Related: Observability.