
Global data center electricity use is set to roughly double by 2030. Here is what the IEA, Goldman Sachs and EPRI numbers actually say, why the grid is the bottleneck, and how hyperscalers are scrambling for power.
How much AI data center power will the world need by 2030?
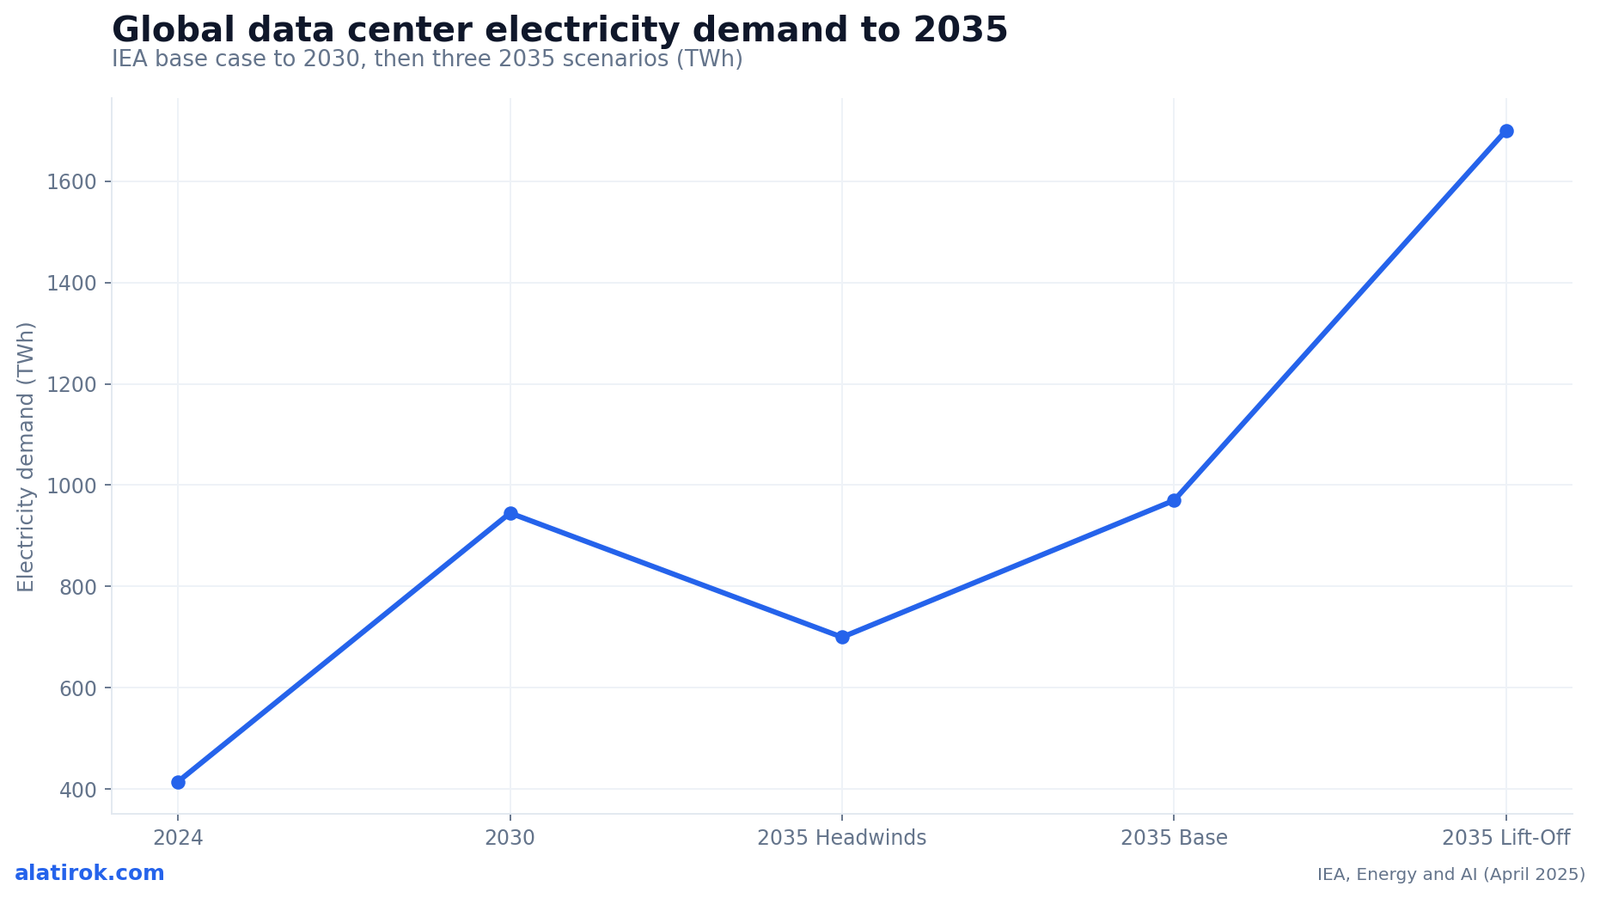
Global data center electricity use is projected to roughly double from about 415 TWh in 2024 to around 945 TWh by 2030, according to the IEA — and AI is the single biggest reason. That 945 TWh figure, from the IEA’s April 2025 Energy and AI report, would put data centers at just under 3% of total global electricity consumption, up from about 1.5% in 2024.
The headline number hides a more violent split underneath it. The IEA models conventional servers growing at roughly 9% per year, but electricity use in accelerated (AI) servers grows about 30% annually in the base case. AI is not adding evenly to the load curve; it is bending it. Overall, data center electricity grows around 15% per year through 2030 — more than four times faster than electricity demand from every other sector combined.
Other credible analysts land higher than the IEA. Goldman Sachs initially projected a 165% increase in data center power demand by 2030 and has since revised toward a ~220% surge, implying roughly 1,350 TWh globally and around 122 GW of data center capacity online by the end of the decade. The forecasts disagree on magnitude, but every serious one agrees on direction: this is the steepest sustained electricity load growth the developed world has seen in a generation. The question for builders, utilities and regulators is no longer whether AI data center power demand explodes — it is whether the grid can physically deliver it.
The numbers behind AI data center power demand through 2030
The clearest way to see AI data center power demand is as a single line that bends sharply upward after 2024, then fans out into a range of 2035 outcomes depending on efficiency and AI adoption. The IEA’s base case is the spine of that line; the divergence comes later, driven by how fast models scale versus how fast serving stacks get efficient.
By 2035 the IEA models three very different worlds. The Lift-Off Case reaches roughly 1,700 TWh (about 4.4% of global demand) if AI adoption accelerates with weak efficiency gains. The High Efficiency Case lands near 970 TWh, barely above the 2030 base case, if algorithmic and hardware efficiency keep pace. The Headwinds Case — supply-constrained, slower adoption — sits around 700 TWh. The spread between Lift-Off and High Efficiency is roughly 730 TWh, larger than the entire 2024 data center footprint. Efficiency, in other words, is a power plant.
Geographically the growth is concentrated. The IEA expects US data center consumption to rise by about 240 TWh (up 130%) and China by about 175 TWh (up 170%) between 2024 and 2030 — together nearly 80% of global growth. In the US specifically, EPRI projects data centers could reach 9% of national electricity by 2030 (some scenarios run to 17%), up from roughly 4% in 2023, with hotspots like Virginia potentially hitting 41-59% of in-state electricity.
Watch the units. Analysts quote TWh (energy consumed over a year) and GW (instantaneous capacity) interchangeably, but they answer different questions. TWh tells you how much generation must be built; GW tells you how much of the grid must be available at peak. A 1 GW AI campus running near-flat 24/7 can consume ~8-9 TWh a year — closer to a steel mill than an office park.
Why the grid, not the chips, is the real bottleneck
~2,300 GW
Capacity stuck in US interconnection queues
More than total installed US capacity
5-7 yrs
Lead time for new combined-cycle gas turbines
OEM backlog ~80 GW vs ~30 GW/yr build
~5 yrs
Average time a project spends in the queue
Roughly double the wait of 15 years ago
1.2 GW
Cap on OpenAI’s Abilene Stargate campus
Capped after grid delays exceeded a year
The binding constraint on AI data center power through 2028 is not GPU supply — it is the grid’s ability to interconnect new load and bring new generation online. You can take delivery of a rack of GB200s in months; energizing the megawatts to run them can take five years or more.
The interconnection queue is the choke point. Roughly 2,300 GW of generation and storage is currently stuck in US interconnection queues — more than the entire installed US power capacity — and projects now spend an average of about five years in queue before reaching commercial operation. On the generation side, the gas turbine supply chain has seized up: lead times for new combined-cycle gas turbines have stretched to roughly 5-7 years, with OEM order backlogs around 80 GW against industry build capacity near 30 GW per year. Turbines ordered today are being slotted for 2028-2030 delivery.
The clearest proof that grid timing now dictates strategy: OpenAI and Oracle capped their flagship Stargate campus in Abilene, Texas at 1.2 GW after grid interconnection delays exceeded a year, scrapping a planned 600 MW expansion. When the most capitalized AI project on earth gets throttled by an interconnection study, the constraint is structural, not financial. Forecasters broadly expect the supply-demand imbalance to stay acute through at least 2028-2029, when generation and transmission currently in development finally lands.
The energy-procurement scramble: nuclear, gas and SMR deals
Unable to wait on the grid, hyperscalers are buying generation directly — restarting nuclear plants, signing multi-decade PPAs, and funding small modular reactors and behind-the-meter gas. The defining feature of 2024-2026 is that compute companies have become energy companies by necessity.
Microsoft anchored the trend by agreeing to a 20-year power purchase agreement with Constellation to restart the 835 MW Unit 1 at Three Mile Island — rebranded the Crane Clean Energy Center — at a restart cost near $1.6 billion, backed by a $1 billion US Department of Energy loan, targeting 2027-2028. Amazon expanded its relationship with Talen Energy to take up to 1,920 MW of carbon-free nuclear power through 2042, and invested in X-energy to bring more than 5 GW of new SMR-based capacity online by 2039. Google signed the first corporate SMR agreement with Kairos Power for 500 MW, first unit targeted around 2030.
Meta is building at a scale that requires its own power fleet. Its Prometheus site in Ohio (~1 GW) is slated to come online in 2026, while the Hyperion campus in Louisiana targets 5 GW by 2030 — and Meta struck a deal with Entergy for roughly 10 new gas plants totaling 5.2-plus GW, committing to fund the construction plus 2.5 GW of new renewables and 240 miles of transmission. The table below maps the major commitments.
| Buyer | Source / partner | Capacity | Type | Target |
|---|---|---|---|---|
| Microsoft | Constellation — Three Mile Island / Crane | 835 MW | Nuclear restart (20-yr PPA) | 2027-2028 |
| Amazon | Talen Energy (Susquehanna) | up to 1,920 MW | Existing nuclear PPA | through 2042 |
| Amazon | X-energy | >5 GW | SMR (new build) | by 2039 |
| Kairos Power | 500 MW | SMR (molten salt) | first unit ~2030 | |
| Meta | Entergy (Prometheus, Ohio) | ~1 GW | Gas + nuclear-backed | 2026 |
| Meta | Entergy (Hyperion, Louisiana) | 5.2+ GW | New gas plants | ramping to 2030 |
| OpenAI / Oracle | Stargate (Abilene, TX) | 1.2 GW (capped) | Mixed / grid-tied | mid-2026 |
Who pays? The ratepayer and grid-cost problem
When data center load arrives faster than generation, existing electricity customers absorb part of the cost — and in the largest US grid that bill is already landing. The PJM Interconnection capacity market, which pays generators to be available at peak, is the clearest signal.
PJM capacity prices went vertical as data center load forecasts climbed: from $28.92/MW-day in the 2024/2025 delivery year to $269.92/MW-day in 2025/2026, then $329.17/MW-day for 2026/2027 — roughly a tenfold jump. Analyses attribute about 63% of one auction’s price increase (around $9.3 billion in cost) to data centers, and the roughly 67 million residents in PJM territory face average bill increases near 15% relative to the pre-AI-data-center baseline. Residential bills in parts of Maryland and Ohio are estimated to rise $16-18 per month from capacity costs alone.
This is the political fault line of the buildout. NRDC has estimated $100-163 billion in cumulative excess costs through 2033 absent regulatory intervention. Utilities, regulators and big-tech buyers are now fighting over cost-allocation rules, special data center tariffs, and whether new large loads should be required to ‘bring their own generation.’ For the AI industry, the risk is not just higher input costs — it is a public backlash that translates into permitting friction and moratoria right when speed matters most.
“Compute companies have quietly become energy companies. The constraint that decides who wins in AI through 2028 is measured in megawatts and interconnection studies, not FLOPS.”
Alatirok analysis
What this means for AI builders and operators
For anyone running AI workloads, the power crunch shows up as GPU scarcity, regional capacity limits and a steady upward drift in the all-in cost of inference — and the defensive moves are efficiency and provider diversity. You do not need to sign a nuclear PPA to be exposed to one.
The pros and cons below frame the trade-offs every operator is now navigating: chasing the cheapest power can mean stranding capacity behind a five-year interconnection queue, while behind-the-meter gas buys speed at the cost of emissions and reputational risk. The strategic insight from the IEA’s scenarios is that efficiency is the highest-leverage variable on the entire curve — roughly 730 TWh separates the Lift-Off and High Efficiency 2035 cases, a gap larger than today’s total data center footprint.
Pros
Cons
Outlook: the buildout meets physics
Power, not silicon, is the gating factor for AI through 2030
Through at least 2028-2029, AI data center power demand will outrun the grid’s ability to supply it cleanly and on schedule, forcing a messy mix of nuclear restarts, new gas, SMRs and efficiency gains. The forecasts will keep getting revised — Goldman already moved from 165% to ~220% — but the structural story is set.
Three things to watch from here. First, the energized-versus-announced gap: track how many of the headline gigawatts actually interconnect on time versus slip into the 2030s. Second, the efficiency lever: if the High Efficiency trajectory holds, 2035 demand lands near 970 TWh instead of 1,700 TWh, and a lot of the panic deflates. Third, the politics: PJM-style rate shocks and bring-your-own-generation rules will shape where the next wave of capacity can even be built.
The AI race is often narrated as a contest of models and chips. For the next several years, it is at least as much a contest of who can secure firm power fastest — and who can use the least of it per token. That is the lens worth keeping on every gigawatt headline between now and 2030.
Builder’s take
I run inference at scale on Cyntr and Loomfeed, so the power curve is not abstract to me — it shows up as GPU availability and per-token cost. A few things I keep telling other builders:
- The binding constraint through 2028 is not chips, it is megawatts and interconnection. You can buy a rack faster than you can energize it.
- Watch the gap between announced gigawatts and energized gigawatts. Stargate getting capped at 1.2 GW in Abilene over grid delays is the tell — press releases are written in nameplate capacity, reality is written in interconnection studies.
- Behind-the-meter gas and on-site generation are winning on speed, not economics. If your roadmap assumes clean grid power on a 2027 timeline, rebuild the assumption.
- Efficiency is your cheapest power plant. The difference between the IEA Lift-Off and High Efficiency cases is ~730 TWh by 2035 — model size discipline and better serving stacks move that number more than any PPA.
- If you are small, your hedge is inference efficiency and provider diversity. The power scramble is a hyperscaler problem you inherit as a price signal.
Frequently asked questions
The IEA projects global data center electricity consumption roughly doubles from about 415 TWh in 2024 to around 945 TWh by 2030 — just under 3% of global electricity. AI accelerated servers drive most of that, growing about 30% per year. Goldman Sachs forecasts even higher, near 1,350 TWh globally.
You can take delivery of GPUs in months, but energizing the megawatts to run them can take five years or more. Roughly 2,300 GW of generation sits in US interconnection queues, and new gas turbines carry 5-7 year lead times. OpenAI’s Abilene Stargate campus was capped at 1.2 GW specifically because of grid delays.
Microsoft signed a 20-year PPA to restart Three Mile Island’s 835 MW Unit 1 (the Crane Clean Energy Center). Amazon took up to 1,920 MW from Talen through 2042 and backed X-energy for 5-plus GW of SMRs by 2039. Google contracted 500 MW of SMRs from Kairos Power.
Yes, in some regions. In the PJM grid, capacity prices jumped from $28.92/MW-day (2024/25) to $329.17/MW-day (2026/27). Data centers were tied to about 63% of one auction’s increase, and roughly 67 million PJM residents face average bill increases near 15% versus the pre-AI-data-center baseline.
EPRI estimates US data centers could reach about 9% of national electricity generation by 2030 — some scenarios run as high as 17% — up from roughly 4% in 2023. In concentrated hubs like Virginia, data centers could consume 41-59% of in-state electricity by 2030.
The two highest-leverage moves are inference efficiency and provider diversity. The IEA’s scenarios show efficiency alone separates the 2035 high (~1,700 TWh) and efficient (~970 TWh) cases by more than today’s total data center footprint. Reducing energy per token cuts cost and exposure more than any single power deal.
Primary sources
- Energy demand from AI — Energy and AI report — IEA
- AI to drive 165% increase in data center power demand by 2030 — Goldman Sachs
- Data Centers Could Consume up to 9% of US Electricity by 2030 — EPRI
- Constellation to restart Three Mile Island unit, powering Microsoft — World Nuclear News
- Talen expands nuclear relationship with Amazon (8-K) — Talen Energy / SEC
- OpenAI and Oracle cap Abilene Stargate at 1.2 GW — Tom’s Hardware
- Jet engine and turbine shortages stretch wait times into 2030 — Tom’s Hardware
- Data centers drive 76% surge in PJM power prices — E&E News / POLITICO
- Meta’s Hyperion and Prometheus power challenges — Data Center Frontier
Last updated: May 31, 2026. Related: Observability.