
Every headline grabs one scary number. We reconcile the 40%, 80.3%, 95% and 89% figures into a single sourced scoreboard so you know what each one actually measures.
What is the real AI agent failure rate in 2026?
There is no single AI agent failure rate in 2026 — the honest answer is that the only number measuring agents specifically is Gartner’s forecast that over 40% of agentic AI projects will be canceled by the end of 2027. Every other scary figure you have seen (80.3%, 95%, 89%, 88%) measures a broader category — all enterprise AI, all generative AI pilots, or all AI proofs-of-concept — at a different lifecycle stage, from a different source, with a different denominator and year. Conflating them is how a vendor blog turns one statistic into panic.
The problem with the discourse is that each ranker cherry-picks whichever number sells the headline. “95% of AI fails!” and “40% of agents get canceled!” describe completely different things: one is a generative-AI pilot study from MIT, the other is a forward-looking agentic-AI forecast from Gartner. They are not the same metric, they do not share a denominator, and you cannot average them.
This article does the work nobody else does: it reconciles every major AI agent failure rate 2026 statistic into one scoreboard, tagging each figure with its source, publication year, scope (all-AI versus agentic), the lifecycle stage it measures, and the denominator. Then we isolate the agentic-AI subset so you can see which numbers actually apply to agents — and which are being borrowed from the wider AI-project literature to inflate the fear.
Read the scoreboard before you quote any of these numbers in a board deck. Using the wrong denominator is the fastest way to lose credibility with a CFO who has read the same studies you have.

The 2026 AI agent failure rate scoreboard, fully sourced
Here is the reconciled scoreboard. Each row is one widely-quoted statistic; the columns tell you who said it, when, whether it measures all AI or agents specifically, the lifecycle stage it captures, and the denominator — so you can finally compare apples to apples.
Notice the pattern: only the 40% Gartner figure (highlighted) is agentic-AI specific. The 80.3% and 95% numbers describe all enterprise AI and all generative-AI pilots respectively. The 88% and 89% production-gap figures measure AI proofs-of-concept and piloted projects broadly, not agents in isolation. When a headline applies the 95% MIT number to “AI agents,” it is silently swapping one denominator for another.
The chart below colors each bar by scope so the agentic-AI subset is visually isolated from the all-AI and all-GenAI figures. The lone agentic bar is the 40% cancellation forecast — everything taller is measuring a wider population.
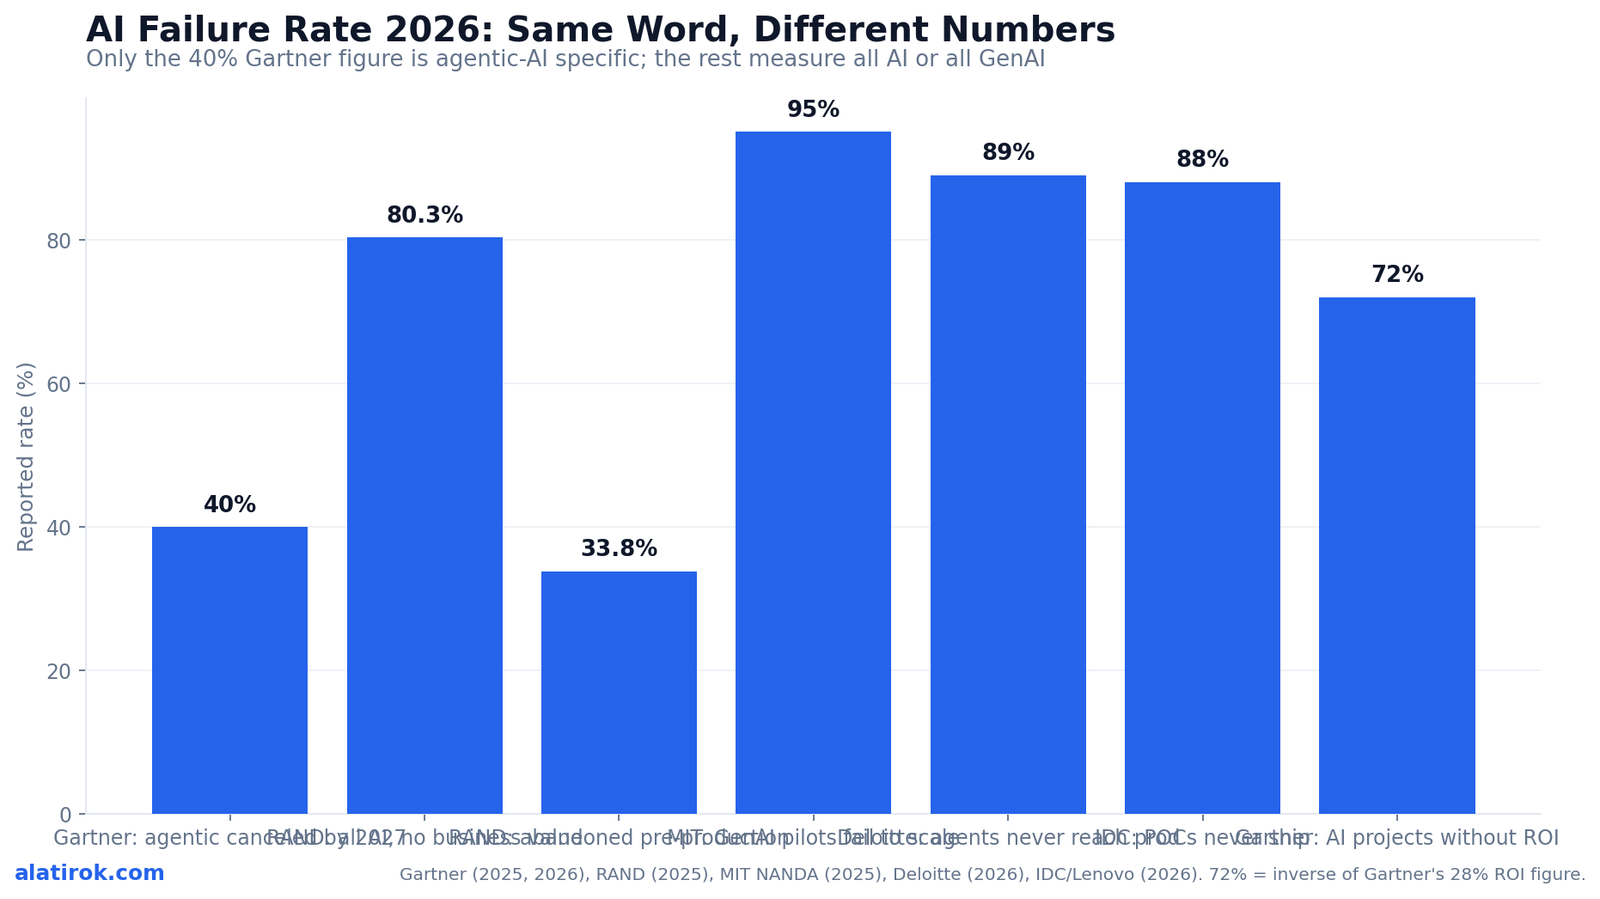
If a post cites ‘95% of AI agents fail,’ check the source. The 95% is MIT’s figure for generative-AI pilots, not agentic-AI projects. The agentic-specific number is Gartner’s ~40% cancellation forecast — a different scope, stage and year.
| Figure | Source + Year | Scope | Lifecycle stage measured | Denominator |
|---|---|---|---|---|
| ~40% canceled | Gartner, Jun 2025 forecast (for end of 2027) | Agentic AI | Projects abandoned by 2027 (cost / value / risk) | Agentic AI projects |
| 80.3% no business value | RAND 2025, reaffirmed by Gartner Apr 2026 | All enterprise AI | Whole lifecycle (fails to deliver value) | All AI projects |
| 33.8% abandoned pre-production | RAND 2025 (subset of 80.3%) | All enterprise AI | Killed before reaching production | All AI projects |
| ~95% pilots fail | MIT NANDA, Aug 2025 | Generative AI | Pilots that never scale to P&L impact | 300 public GenAI deployments + 350 surveyed |
| ~89% never reach production | Deloitte, 2026 tech trends | Piloted AI / agents | Pilot-to-production failure | Enterprises that piloted |
| 88% of POCs don’t ship | IDC + Lenovo, 2026 | AI POCs | Proof-of-concept to wide deployment | AI POCs (4 of 33 graduate) |
| 28% deliver ROI | Gartner, Apr 2026 (782 I&O leaders) | AI in I&O | In production, meets ROI expectations | AI use cases in I&O |
Gartner’s 40% agentic AI projects canceled 2027: what it really says
Gartner predicts over 40% of agentic AI projects will be canceled by the end of 2027, driven by escalating costs, unclear business value, and inadequate risk controls — and this is the single statistic that genuinely measures agents rather than AI broadly. The forecast came in Gartner’s 25 June 2025 press release and is the anchor for any serious conversation about the AI agent failure rate 2026 and beyond.
The context matters as much as the number. Gartner’s analysts attribute much of the risk to “agent washing” — vendors rebranding chatbots, RPA, and assistants as agents without substantial agentic capability. Senior director analyst Anushree Verma noted that most agentic AI projects today are “early-stage experiments or proof of concepts that are mostly driven by hype and are often misapplied.” Gartner estimates only around 130 of the thousands of self-described agentic vendors offer genuine agentic features.
Crucially, 40% canceled is not 40% of agents that technically fail. It is a portfolio-level prediction about projects organizations will choose to kill because the math stops working — runaway inference costs, governance gaps, or value that never materializes. That makes it a managerial and economic forecast, not a benchmark of agent reliability.
It is also forward-looking to end of 2027, not a measured 2026 outcome. Treat it as the base rate to beat: if your agent program has clear value attribution and risk controls, you are explicitly designing yourself out of the 40%.
“Only about 130 of the thousands of self-described agentic vendors offer genuine agentic features. The rest is agent washing.”
Gartner, June 2025
What percentage of AI agent projects fail before production?
For all enterprise AI, RAND found that 33.8% of projects are abandoned before they ever reach production — and broader pilot-to-production studies put the failure rate at 88% (IDC POCs) to 89% (Deloitte piloted projects). These are the closest proxies for early-stage agent failure, but none isolates agents alone.
RAND’s widely-cited 80.3% “no business value” figure decomposes into four stages, which is why it is so often misquoted. Only the 33.8% slice is true pre-production abandonment. The rest fail later in the lifecycle, and lumping them together overstates how many projects die early.
The production-gap statistics tell a sharper version of the same story. IDC’s research with Lenovo found 88% of AI proofs-of-concept never graduate to wide deployment — only four of every 33 POCs make it. Deloitte’s 2026 technology trends report puts pilot-to-production failure at roughly 89%. Both measure broad AI or piloted-agent populations, not a clean agentic-only sample, which is exactly the nuance the cherry-picking headlines drop.
The takeaway for agent builders: the dangerous transition is not building the demo — it is crossing into production with ownership, monitoring, and a value case intact. That is where one-in-three to nine-in-ten projects die, depending on which denominator you use.
| Stage | Share of all AI projects | What happened |
|---|---|---|
| Abandoned pre-production | 33.8% | Killed before ever shipping |
| In production, no value | 28.4% | Shipped but missed expected value |
| Runs but can’t justify cost | 18.1% | Some value, negative net ROI |
| Meets or exceeds objectives | 19.7% | Actual success |
AI pilot abandonment rate 2026: GenAI vs traditional AI
The AI pilot abandonment rate 2026 is dramatically higher for generative AI than for traditional AI — roughly 95% of GenAI pilots fail to scale (MIT) versus around 34% abandonment for traditional AI projects. This gap is the most misused statistic in the entire conversation, because the 95% gets reflexively applied to agents.
MIT’s NANDA initiative published “The GenAI Divide: State of AI in Business 2025” in August 2025, based on 150 leader interviews, a 350-employee survey, and analysis of 300 public deployments. Its headline: about 5% of GenAI pilots achieve rapid revenue acceleration; the other 95% stall with little measurable P&L impact. MIT pinned the cause on a “learning gap” in enterprise integration — not model quality.
One under-quoted MIT finding is the most actionable: buying AI tools from specialized vendors and building partnerships succeeds about 67% of the time, while internal builds succeed only about one-third as often. The failure rate is not destiny — it is heavily a function of build-vs-buy and scope.
So when you see “95% of AI agents fail,” mentally substitute the accurate claim: 95% of generative-AI pilots fail to scale, per MIT, 2025. Agentic AI inherits some of this risk because most agents are built on the same GenAI stack — but the agentic-specific forecast remains Gartner’s 40%, not 95%.
Most 2026 agents are orchestration layers over the same LLMs MIT studied. So the 95% GenAI pilot risk partly bleeds into agent programs — but it is a related risk, not the same metric. Cite the 40% for agents; cite the 95% for GenAI pilots.
How many AI agents reach production, and why do the rest fail?
Across the broad pilot-to-production studies, only about 11% to 12% of AI/agent pilots reach wide production (the inverse of the 88%-89% failure figures), and the dominant failure causes are organizational, not technical. The question of how many AI agents reach production has the same denominator caveat — these numbers cover AI pilots and POCs broadly — but the failure-mode analysis is consistent enough to act on.
Gartner’s April 2026 survey of 782 infrastructure and operations leaders (fielded November–December 2025) found only 28% of AI use cases in I&O fully meet ROI expectations and 20% fail outright. Among those who experienced failure, 57% cited “expecting too much, too fast” as the root cause. Around 38% blamed missing in-house expertise and 38% blamed poor data quality or access — leadership and process gaps, not model limitations.
There is one failure mode the macro statistics systematically miss, and it is agent-specific: error-rate compounding. An agent that is 95% reliable per step is only about 0.95^20 ≈ 36% reliable across a 20-step chain. Multi-step autonomy multiplies small per-step error rates into high task-level failure — which is why agents can pass a demo and collapse in production even when no single component is broken.
Pair this with the build-vs-buy data and a clear playbook emerges: narrow scope, buy or partner where you can, instrument per-step reliability, and assign production ownership before the pilot ends. That is how teams land in the 11-12% that ship rather than the majority that don’t.
Pros
Cons
How to beat the AI agent failure rate in 2026
There is no single AI agent failure rate — there is a scoreboard, and you choose which row to beat
To beat the AI agent failure rate 2026, pick one failure metric to optimize, scope agents to a single observable workflow, measure per-step reliability to fight error compounding, and decide build-vs-buy with the data — not the hype. The studies converge on a short, concrete checklist.
First, choose your denominator. Decide whether you are managing against pre-production abandonment (33.8%), production-without-value (28.4%), or cancellation (40%), then instrument that specific outcome. Teams that track “expecting too much, too fast” qualitatively but never define a kill/scale threshold quantitatively are the 57% in Gartner’s survey.
Second, attack error compounding directly. Cap autonomous chain length, add human-in-the-loop checkpoints on high-stakes steps, and report task-level reliability as the product of per-step reliabilities — not the best-case demo run. This is the agent-specific lever the macro failure stats never surface.
Third, respect the build-vs-buy evidence: MIT’s two-thirds success rate for specialized-vendor partnerships versus one-third for internal builds is one of the strongest signals in the dataset. For most teams in 2026, buying a narrow, well-observed agent and earning the right to expand beats building a broad horizontal platform that joins the cancellation column.
Builder’s take
I run two AI products in production, and the gap between the failure headlines and what actually kills a project is wide. The numbers are real, but they get weaponized by people who never read the methodology. Here is what the scoreboard taught me building Cyntr and Loomfeed:
- The 40% Gartner cancellation forecast is the only stat that is genuinely about agents. Everything else (80.3%, 95%) measures all AI or all GenAI. If someone cites the 95% MIT number to scare you off agents, they are conflating denominators.
- Almost every failure I have seen is a denominator-stage failure: the pilot worked, but nobody scoped who owns it in production. The technology was never the bottleneck; the operating model was.
- Error compounding is the quiet agent-specific killer the macro stats miss. A 95%-reliable step run 20 times in a chain lands you near a coin flip. Measure per-step reliability, not demo success.
- The 5-to-20% that succeed almost always bought from a focused vendor or shipped one narrow, observable workflow. Broad horizontal agent platforms are where the sunk cost goes to die.
- Treat every one of these numbers as a base rate to beat, not a verdict. Pick a metric (abandonment vs no-ROI vs canceled), instrument it, and you are already ahead of the 57% who blamed ‘expecting too much, too fast.’
Frequently asked questions
There is no single number. The only figure measuring agents specifically is Gartner’s forecast that over 40% of agentic AI projects will be canceled by the end of 2027. Other widely-quoted numbers — 80.3% (RAND, all AI), 95% (MIT, GenAI pilots), 88-89% (IDC/Deloitte, production gap) — measure broader categories at different lifecycle stages and denominators, so they should not be quoted as ‘the agent failure rate.’
Gartner predicts over 40% of agentic AI projects will be canceled by end of 2027 due to escalating costs, unclear value and weak risk controls. For all enterprise AI, RAND found 80.3% deliver no business value, including 33.8% abandoned before production. The 40% figure is the agentic-specific one; the 80.3% covers all AI projects.
No. Gartner’s prediction, published in June 2025, is forward-looking to the end of 2027. It forecasts that over 40% of agentic AI projects will be canceled by then. Reporting it as a measured 2026 outcome is a common error; it is a projection about future portfolio decisions, not a benchmark of current agent reliability.
Because they measure different things. The 95% comes from MIT’s August 2025 study of generative-AI pilots that fail to scale to P&L impact. Gartner’s 40% is a forecast of agentic AI projects that will be canceled by 2027. Different scope (GenAI pilots vs agentic projects), different stage, different year and denominator — the two numbers are not comparable and cannot be averaged.
Broad pilot-to-production studies imply only about 11-12% reach wide deployment — the inverse of IDC’s 88% POC failure and Deloitte’s 89% pilot-to-production failure rates. These cover AI pilots and POCs broadly rather than a clean agentic-only sample, so treat 11-12% as a directional proxy, not an agent-specific measurement.
Across studies the causes are organizational, not technical: unclear value, poor data quality, missing expertise and over-scoping. Gartner’s April 2026 survey of 782 I&O leaders found 57% of those who failed blamed ‘expecting too much, too fast.’ The agent-specific cause the macro stats miss is error-rate compounding — small per-step error rates multiply across long autonomous chains into high task-level failure.
Primary sources
- Gartner Predicts Over 40% of Agentic AI Projects Will Be Canceled by End of 2027 — Gartner
- Gartner finds only 28% of AI projects deliver ROI as most fail to deliver results — Tech Startups
- AI Project Failure Rate 2026: 80% Fail — Pertama Partners
- MIT report: 95% of generative AI pilots at companies are failing — Fortune
- 88% of AI pilots fail to reach production — but that’s not all on IT — CIO / IDC
- Gartner: 40% of agentic AI projects will fail, making humans indispensable — MarTech
Last updated: June 2, 2026. Related: Observability.